Laura Stewart, Executive Director, NAPCORNAPCOR
Packaging World:
This year’s report indicates that the U.S. PET bottle recycling rate reached 33% in 2023—the highest since 1996. What specific initiatives or policies contributed to the 4% rise in the recycling rate from 2022 to 2023?
Laura Stewart:
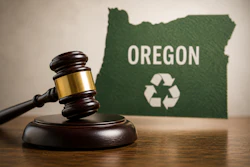
We can point to two different levers. The first is a continued increase in the collection of PET bottles. Some of this is done through curbside initiatives—so an increase of PET bottles making their way into the bins at our households. The other is through legislation or deposit redemption systems [DRS]. We have 10 states that currently collect PET bottles through that system, and we continue to see good results from those states. In fact, states like Oregon, which has had a DRS for many years now, enjoys a nearly 72% recovery rate for PET bottles. This is much higher than the curbside collection rate. We’re also seeing mandates in states like California that require brand owners or beverage container producers to incorporate recycled content in their containers drive the demand for post-consumer recycled PET bottles. So we’re seeing success in those states as well, as brands try to achieve those percentages.
To what extent do you believe voluntary brand commitments contributed to the 16.2% recycled-content rate in 2023??
The 16.2% PCR level in bottles, which is also the highest we’ve ever seen, is pretty tremendous. And while we can’t quantify how much of it is due to legislative mandates versus brand owners’ voluntary commitments, it may be the combination of the two.
California has had the mandated PCR requirement for packaging for two years now, and has a 25% content requirement in 2025. California is a large market, but we feel many brands’ voluntary commitments extend beyond that state. So if you’re producing a beverage container for California’s requirement, it’s likely you would incorporate high levels of PCR in your containers throughout the country.
 | Read this related article from the 2024 Plastics Recycling Summit, “Untangling the Thermoform Recycling Conundrum” |
How does the 33% recycling rate for PET bottles compare to the rates for other commonly used packaging materials during that same period?
We recently compared PET bottle recovery rates to those of aluminum cans. I believe the most current data on the recycling rate for cans is 43% versus PET bottles at 33%. In our opinion, it’s a little closer than many consumers would think when we look at really any beverage container that has the opportunity to be recycled.
We’d like to see much higher numbers. Globally PET bottles exceed a 60% recovery rate. Factors in the U.S. that make it more challenging are the recycling programs, access to recycling, and also consumer behavior to get the beverage container—whether it’s a can or a PET bottle or a glass bottle—in the proper recycling bin.
How did the combination of increased PET bottle collection in 2023 of 1.962 million pounds and the decrease in bottles available for recycling to 5.952 million pounds affect the overall recycling rate?
So the numerator, or the amount that’s collected and processed for recycling, in the U.S., at nearly 2 billion pounds of PET, was the highest ever recorded. So we did see an increase in the amount recovered, but at the same time, we saw a decrease in what we call bottles on the shelf. So the math in that situation works out that the percentage will be higher simply because the amount of bottles sold was lower. However, I don’t want to lose sight of the fact that the recovery rate continued to increase, so we are moving directionally on the right course.
Circularity is the thing to point out over and above the amount that’s collected. More PET bottles are getting turned back into PET bottles. The percentage of PCR bottles being recycled that end up in new bottles is 16.2%. That’s also a record in 2023. So we’re seeing circularity occur. We’d love to see more products and packaging utilizing PET. We think it’s a great material with a lot of sustainability advantages when we look at it from a lifecycle analysis perspective.
Why do you think there were there fewer bottles on the shelf in 2023?
We still look at things such as coming off COVID. In 2023, consumers were coming back to restaurants, to events, things like that. From 2020 through 2023, we did see some varying degrees of what we call the denominator or bottles on the shelf. So we don’t know exactly why we’re seeing that downward trend in 2023, but we’ll be monitoring it as we produce the 2024 report to see if that corrects itself or if it’s continuing to decline. But at this point, we don’t really understand what’s driving that downward trend.
What factors drove the record bottle-to-bottle recycling rate of 16.2%?
I think the 16.2% incorporation of rPET into bottles is very significant. There are technical advances that allow bottles to be made with such high levels of PCR, so that’s one area of improvement. The second is really the driver of legislative requirements. States like California that are requiring minimum PCR are driving that and pushing companies to incorporate that into their bottles, and we’re seeing it manifest. Many of the leading brands, as reported in the annual CalRecycle plastic recycled content report, are achieving those mandates.
Are there significant differences in PET bottle recycling rates across various regions or states within the U.S., and what factors contribute to these variations?
There are a lot of reasons. We see differences across the U.S., even within certain states. Certainly states that have strong deposit redemption system programs for their beverage bottles see higher recovery rates than states that simply rely on curbside. As I mentioned, in Oregon for example, they enjoy 72% recovery rate and they have a strong DRS program. Over and over again, we see higher recycling rates in states with those programs than in states that don’t. We also see less access to curbside in rural communities. In the U.S. alone, there’s access for 88% of households to some sort of recycling program for PET, but there are still communities that don’t have easy access to recycling.
Are there limitations in the U.S. recycling infrastructure that could impact the future growth of PET bottle recycling rates?
In terms of the progress that’s been made and the infrastructure developments that have been made over time to make PET bottle recovery viable, there continue to be improvements. In just the last few years, we’ve seen market improvements in using automation and robotics to improve the yield and quality in bales. There is still more work to be done, and we want to make sure that whether it’s an aluminum can, paper, a PET plastic, or HDPE, those materials get to their proper recycling streams so they can be utilized into other products.
The challenge we all face is that folks don’t lose hope on recycling. When I open my newsfeed and I see things like recycling doesn’t work or we’d be better off putting it in the landfill, it’s really frustrating because I know that the livelihood of the reclamation industry really relies on consumer participation. So it does have to happen with all of us, each and every one, but we need to make it easy for consumers to recycle. It shouldn’t be something we have to think a lot about—it should just be an automatic practice.
We talked a little bit about that piece of the puzzle that we don’t have a lot of control over, which is the consumer putting that bottle into the bin, yet collection did go up in 2023. What strategies have proven effective in encouraging higher participation in recycling?
The programs that work the best in terms of recovery and collection that we see over and over again are redemption programs—where there is an incentive for the consumer to return that bottle, whether it’s to a reverse vending machine or to a retailer that is taking those bottles back. We also recently came across a study from MIT that showed that a national DRS program could push PET recycling rates to as high as 82%. That really gave us pause and reinforced what we’ve seen in states that have some sort redemption program. We do know that that works. We can see it as evidenced in the numbers, but we understand the challenges too. Every state is different and may not have infrastructure in place to be able to process that sort of program. That’s why some of the EPR programs coming into place now are helping bridge the challenges to encourage more participation in recycling, but also the collection and the infrastructure to support it.
What role does NAPCOR play in helping legislators understand the value of bottle bills? What kind of outreach do you do to that segment?
NAPCOR does a number of things to help educate legislators, consumers, and policymakers. Since 2020, we’ve had a program called Positively PET, which has evolved over time. It includes several materials, including fact sheets that help illustrate the benefits of PET and PET recycling, and compare PET to other formats.
| | Read this related article, “NAPCOR Research Indicates Plastic Bottle Ban at S.F. Airport Causes Greater Environmental Damage Than Recycling” |
In the case of states, cities, or communities looking at bans, we want to help educate those policymakers on unintended consequences. For example, sometimes bans can increase your carbon footprint, or you may actually end up putting more material into the landfill than keeping it out of the landfill and out of the environment. While we’re not an advocacy organization in terms of lobbying, we do try to get in front of the policymakers and current state legislators who are looking to pass and implement things like EPR or bottle bills and help communicate the advantages of PET and the incorporation of PET bottles in those bills.
Based on what you’re seeing right now, what do you project for the U.S. PET bottle recycling rates in say, the next five to 10 years?
Well, there’s what I’d like to see, and the reality. We’ll have to wait until we see what our 2024 results look like, which will be published later this year. There’s a lot of energy and activity from many associations, from different industry groups, brand owners, and citizens too—communities and people that are working really hard to make sure we’re doing the best we can with the resources we have. We’re trying to keep product out of landfills where there are good recycling programs in place to recover materials like PET bottles.
I wish I had a crystal ball to see what the future holds. I’m an optimist, so I would like to think that we’re going to see a continued increase in the amount of PET that’s recovered and recycled and that the percentage increases, but some things will need to happen in order for that to happen. And certainly the commitment to use the product in materials like beverage containers, thermoforms, and textiles, and also programs that help educate and encourage consumers about recycling. I feel optimistic that there is a desire to see the numbers grow and increase, but we have to see it manifest. And again, over time, improvements have been made. So I’d like to think that we’re on that continued path.
At a recent sustainable packaging event, there was a lot of excitement around this being a pivotal time for the industry, driven by EPR and emerging technologies like AI. Are you seeing that same energy?
I am. I’ve been in the industry for a long time. I’ve followed PET since the beginning of my career, and I continue to see improvements. Some of the things that have occurred in the last five years or so around automation, sorting improvements, robotics—those types of advances—have really made a difference. I think the other thing that’s going to make a difference for PET is the advancement of molecular recycling. PET is different than other polymers, but with the work that companies like Eastman are doing, we’re going to be able to capture more of that PET molecule that’s out there. It’s really a nice complement to mechanical recycling, which is also continuing to improve through all of the automation and robotics and sensors and sorting technology that’s in place today. That wasn’t around 10 years ago. So I’m optimistic about that. I do feel like the energy is there—certainly the desire to get more product recovered, and again, keep that molecule alive so it can be recycled over and over again.
Do you have any final comments?
I would just restate that PET is the most recycled plastic in the U.S. We want to see those recycling rates continue to increase. We’re encouraged by the results of the 2023 report—it signals potential. With the right policies, infrastructure, and investments, we can drive those gains in recycling. And I guess I would leave it with: PET is a material that’s designed to be recycled. It’s designed for circularity, and we need, again, broader-access legislation and modernized systems to help meet the demands of today. PW