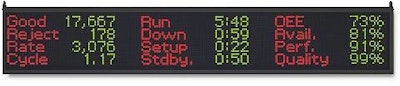
It really is that easy, according to Adam Moran, a salesman with Vorne Co., makers of visual displays and productivity tools. The company’s electronic displays for production lines quantify output and efficiency—“actionable information,” Moran says. The numbers are colored to show general conditions via amber, yellow, and green as an easy-to-see indicator if the performance is on pace or not.
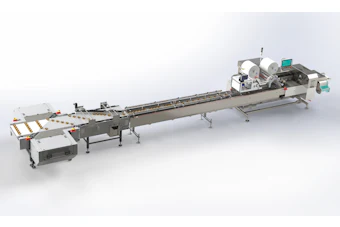
The company’s displays have been a staple in automotive plants for a long time, Moran says, but now they are making inroads into printing, converting, and packaging operations.
He says a rule of thumb is that of 100 employees, 90 are going to be average, five are going to be slackers, and five are going to be all-stars. The display’s presence seems to raise everyone’s “game” cumulatively.
Customers report fast improvements once the displays are installed—without any other changes, according to Moran.
“Just by installing the display and providing the data showing performance against expectation, customers immediately see a bump,” says Moran. “Almost universally, they see a measurable, documented difference.”
Adds 30% to can-maker’s output
Rather than take Moran’s word for it, here’s the comment of one satisfied customer, a maintenance manager at a decorated tin manufacturer:
“The results are amazing! We went from about eight thousand units a day to just over eleven thousand just by putting the displays up. That's an almost 30-percent increase in production and we've been able to sustain our gains. Everybody in the plant just loves the displays. Supervisors, managers, and operators now have a great tool for monitoring the progress of the lines in real time.”
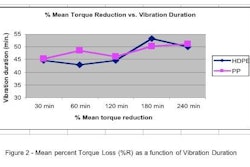
The data uncovered a way in which the operators were handling machinery vibration.
“What happened was that operators found it easier to slow the machinery down rather than readjust it,” Moran says.
Certainly psychology can also come into play, according to Moran. He says that if companies place too high a premium on the green indicator, the goal becomes tantalizingly and frustratingly out of reach. He suggests that instead of setting the green threshold at 95%, set it at 71%. Then when your operators become accustomed to having it green, nudge it up to 74% and so forth.
When downtime occurs, the board changes from production mode to a timer display—total shift downtime and event downtime. He says the display tends to keep a 15-minute downtime from stretching into 30 minutes.
Moran says that the scoreboards are a do-it-yourself install—they don’t require an integrator. Users do need to connect a few sensors, however.
Moran says the units, which have a typical payback of six to 12 months, provide data that’s Internet-accessible for supervisors, including runtime, downtime, and average run rate. Vorne’s latest scoreboard, the XL800, is priced starting at $3ꯠ.