There’s more than one way to interpret the findings, but the just-the-facts-ma’am version is that responses to our annual salary survey skewed younger and less experienced than in years past. Correspondingly, the reported average salary is down, but by a hearteningly small amount.
The glass-is-half-empty approach may bemoan the sheer volume of institutional packaging knowledge—and attendant command of salary—that’s aging out of the packaging workforce. The flat year-over-year salary results are a natural outgrowth of that highly capable, but expensive, exiting cohort.
The positive flip side for the younger workforce is that this dynamic imparts a premium on talented youth that can (at least attempt to) replace the older cohort and do so without the bloated salaries. This youth movement ought to feel secure in their jobs since they are in tight supply, and confident in their upward mobility since fewer people are occupying those places at the top. Indeed, the numbers bear this out (See “Job security is trending up” chart), giving employees an advantage over their packaging industry employers in the salary and job marketplace.
The following charts, graphs, tables, and illustrations will explore this dynamic and several others. Numbers are based off of an online survey, completed in April and early May 2019, which examined annual compensation earned in 2018. Previous years’ results are included for context and trend dimension. Conducted by the Institute of Packaging Professionals and Packaging World magazine, the 2019 Salary Survey is developed in cooperation with Dennis Gros, President, MBS Advisors Recruiting Division, with Kane Consulting tabulating and summarizing the results.
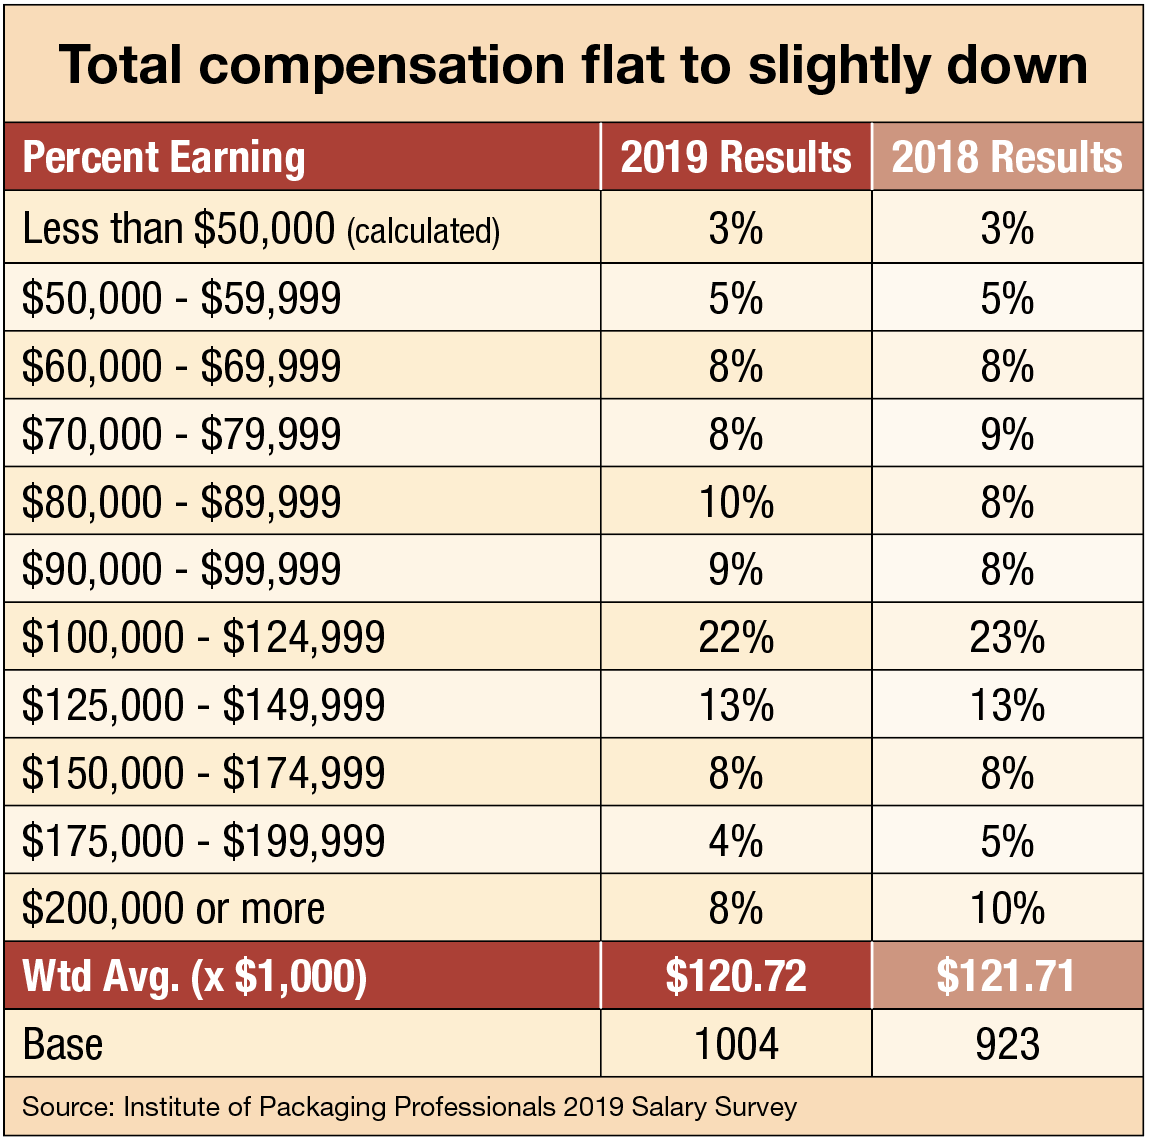
Domestically, the weighted average salary was down slightly in 2018 (as reported in early 2019). The difference? A slight increase in respondents in the $80,000 to $100,000 range, and a corresponding decrease in respondents in the greater than $175,000. More on that in the graphic titled “Youth movement.”
|
PMMI’s Free Career Toolkit: Promoting Awareness of Packaging and Processing Careers |
|
Studies show there will be a shortage of two million workers over the next decade. PMMI’s Career Toolkit providesresources to help companies address the critical shortage of skilled employees and promote awareness of careers in thepackaging and processing industry. The toolkit includes: |
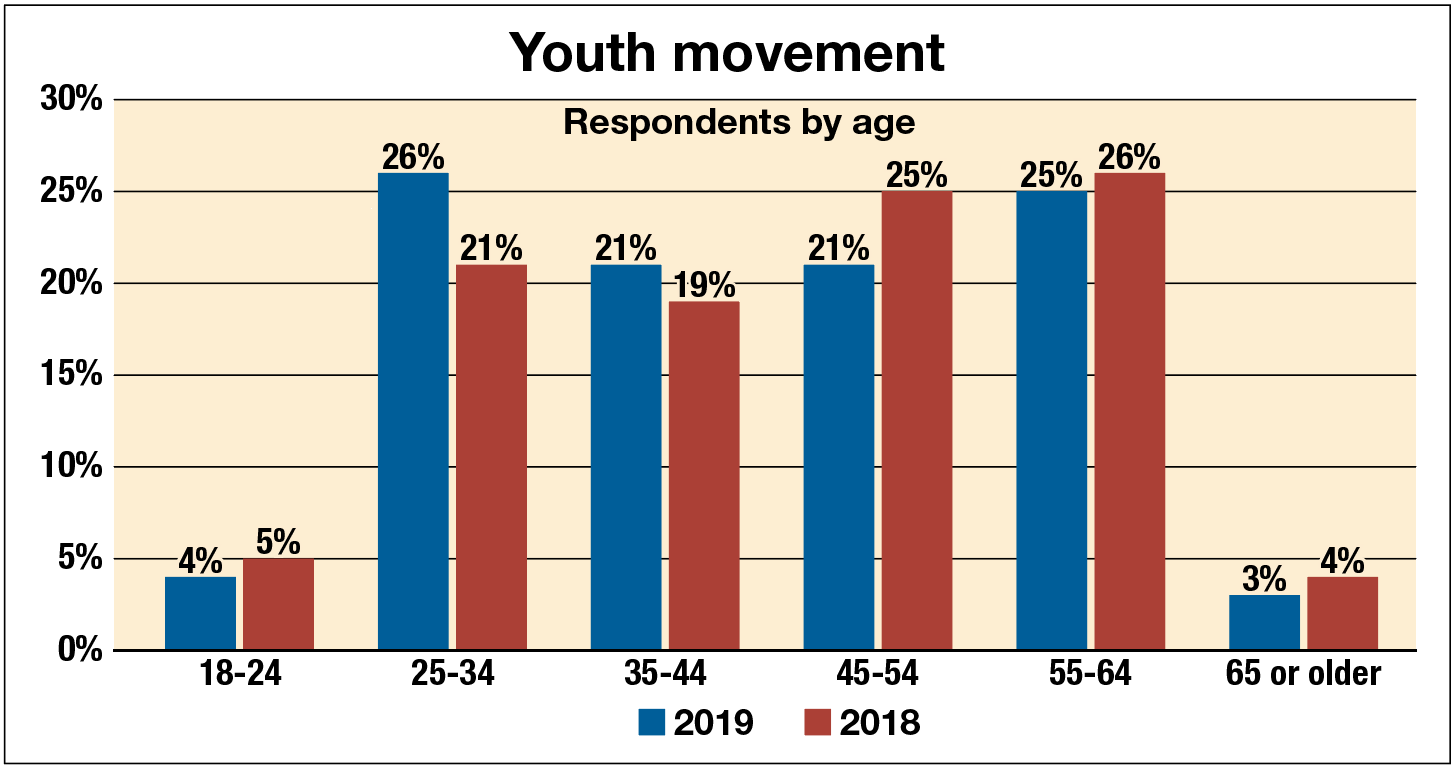
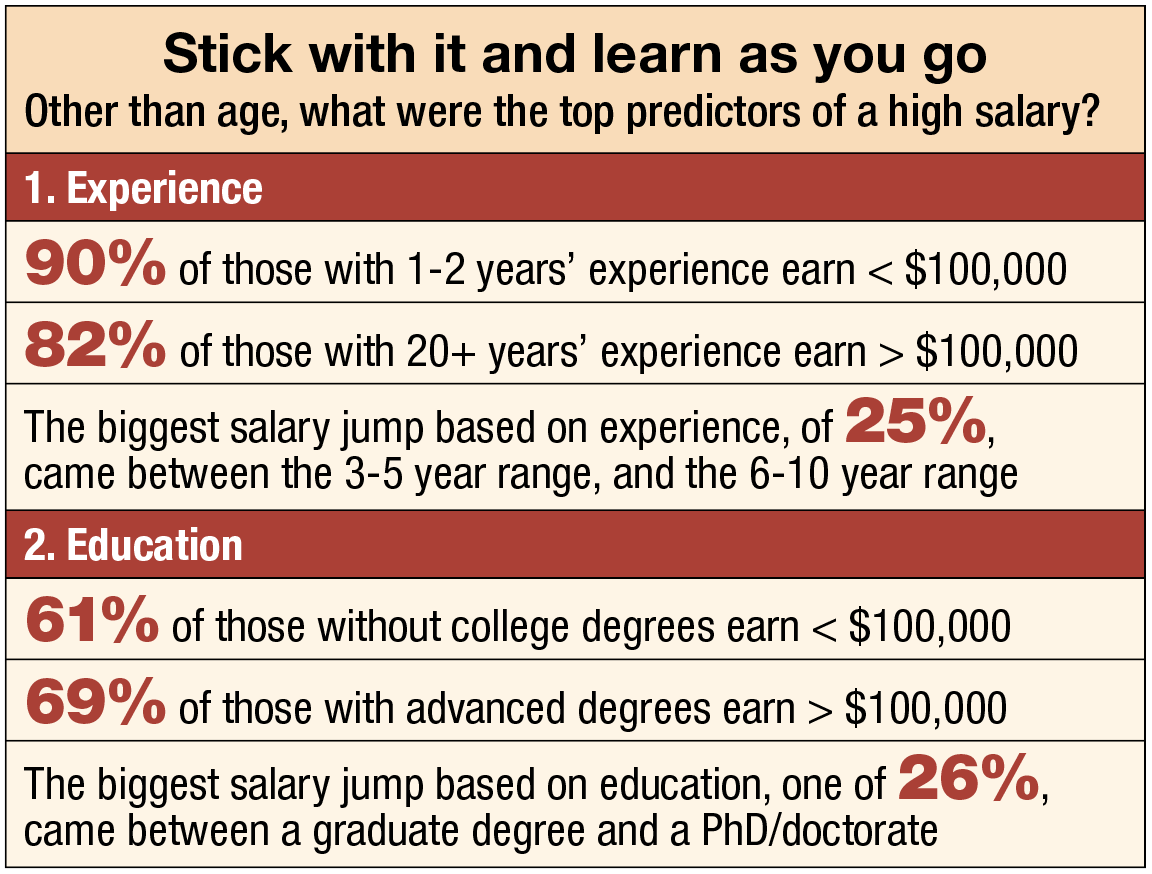
In 2019, we saw a shift in the respondent base. Although the base of respondents increased by almost 5% to 1004 from 923 domestic participants, respondents in 2019 were younger. The average age of respondents dropped from 46 in 2018 to 44 in 2019, a substantial drop in age. As a corollary, the average years of experience in the packaging field fell from 14.7 to 14.1. Finally, only 37% of the respondents to this year’s survey indicated that they recalled taking this survey last year. As a result of these demographic changes among respondents, the overall average salary dropped slightly. The good news is the drop is only slight despite the youth movement, and it is most notably reflected in more respondents in the $80,000 to $100,000 range, and fewer at the top of the pay scale. “Growing old gracefully has a financial benefit,” Gros says. “The highest wage earners are in the 55+ age bracket, with average compensation of [about] $142,000. The highest wage earners also have 20 years or more of experience, at an average $149,110.”
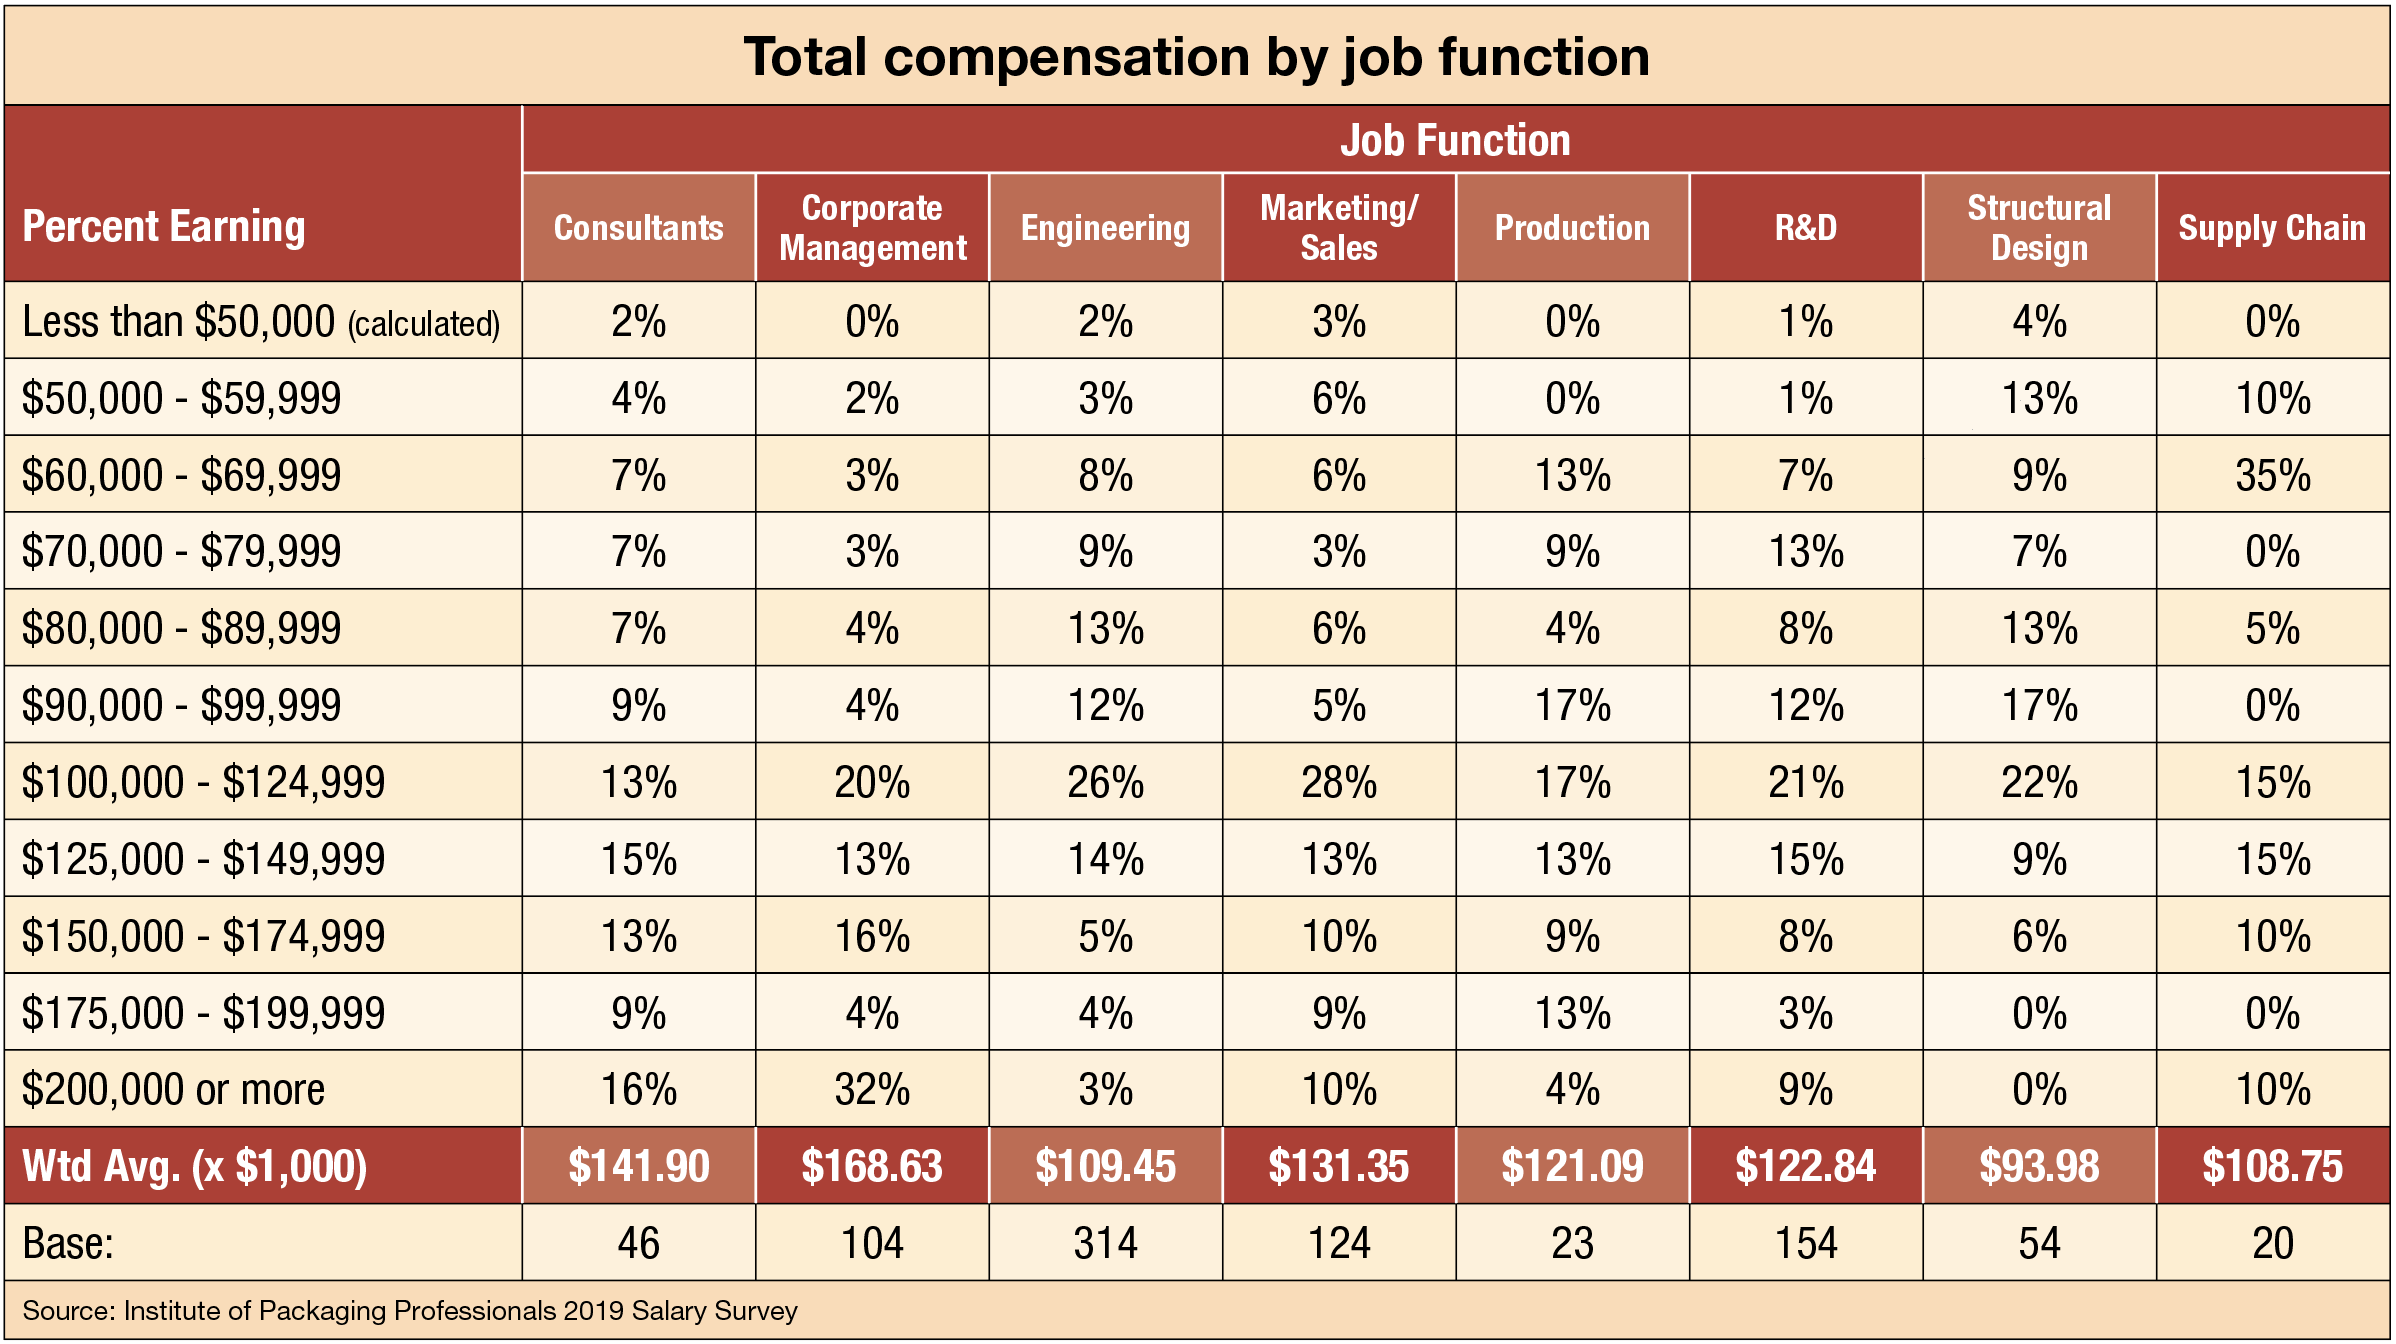
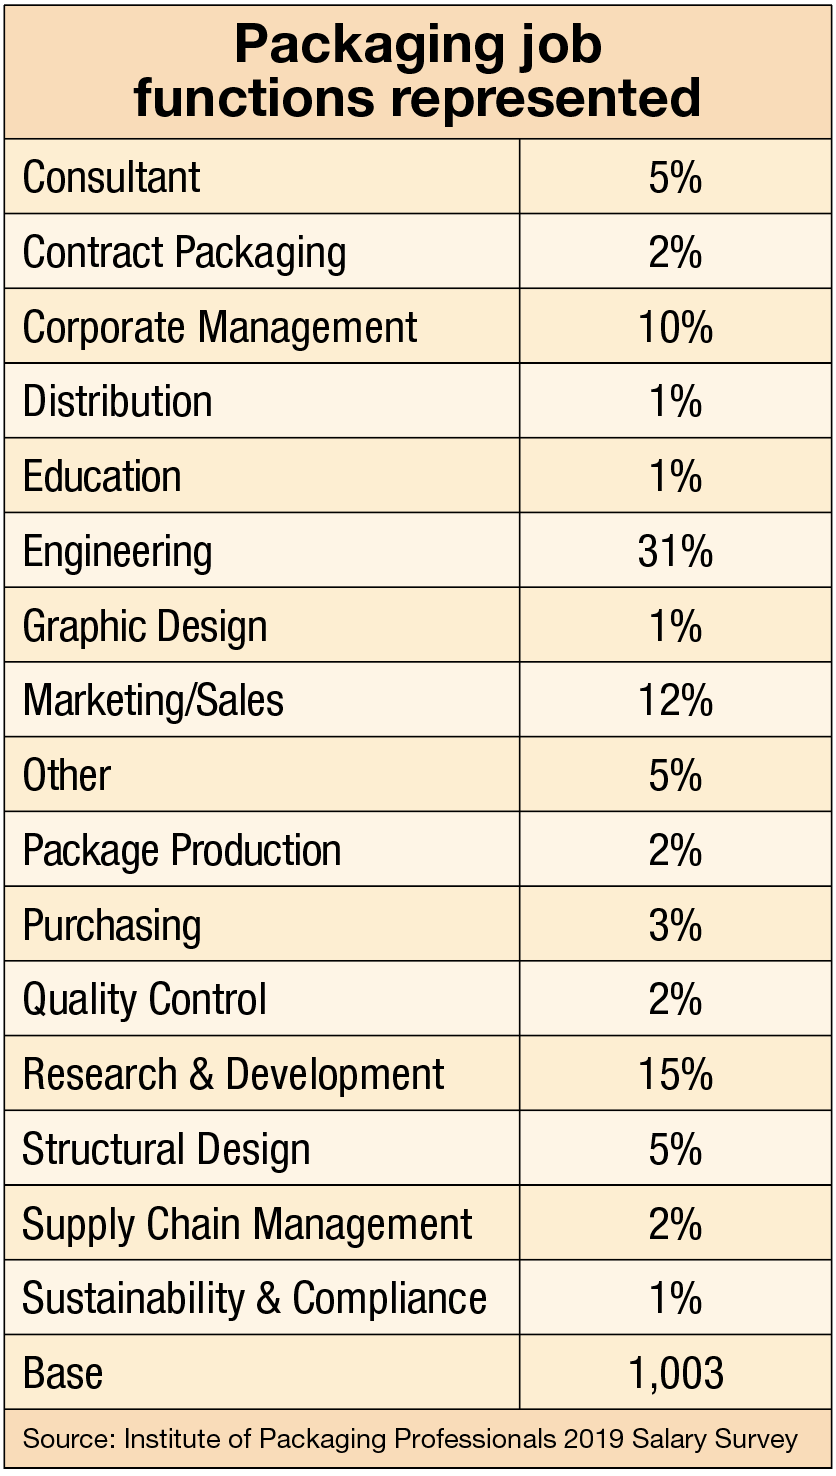
“Where are the big bucks? This ranking will not surprise you,” Gros says. “Corporate Management, then Consultants who work for Corporate Management, then Marketing/Sales, R&D, Production, Engineering, Supply Chain, then Structural Design. Note—in this survey, the people who produce the product earn almost as much as those who are developing the product. In my experience, degrees are optional for many jobs in production. However, an advanced degree is often required for a job in Research and Development.”
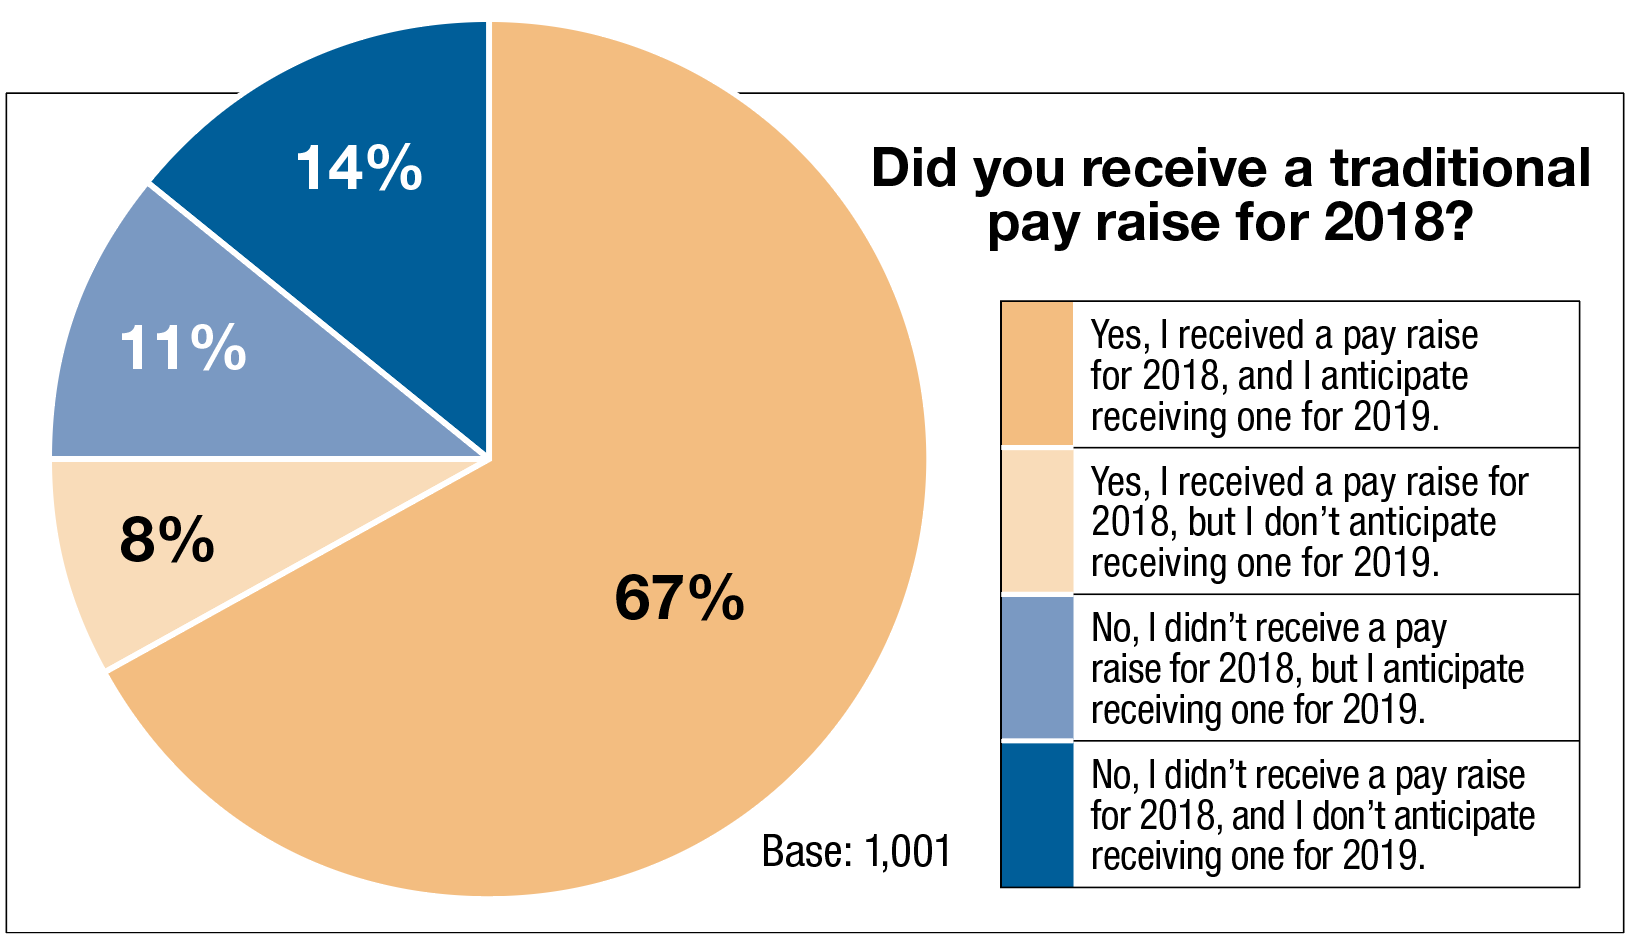
“Show me the money!” says Gros. “This year’s respondents are optimistic, and apparently, enthusiastic.” In a new question for this year, we asked participants if they received a raise in 2018, and if they anticipated receiving one in 2019. Two thirds of respondents appear in the Yes/Yes quadrant of the Mendel square, with another 19% having either recently received one or expect to receive one, implying that while not annual, raises are indeed in play at their company.
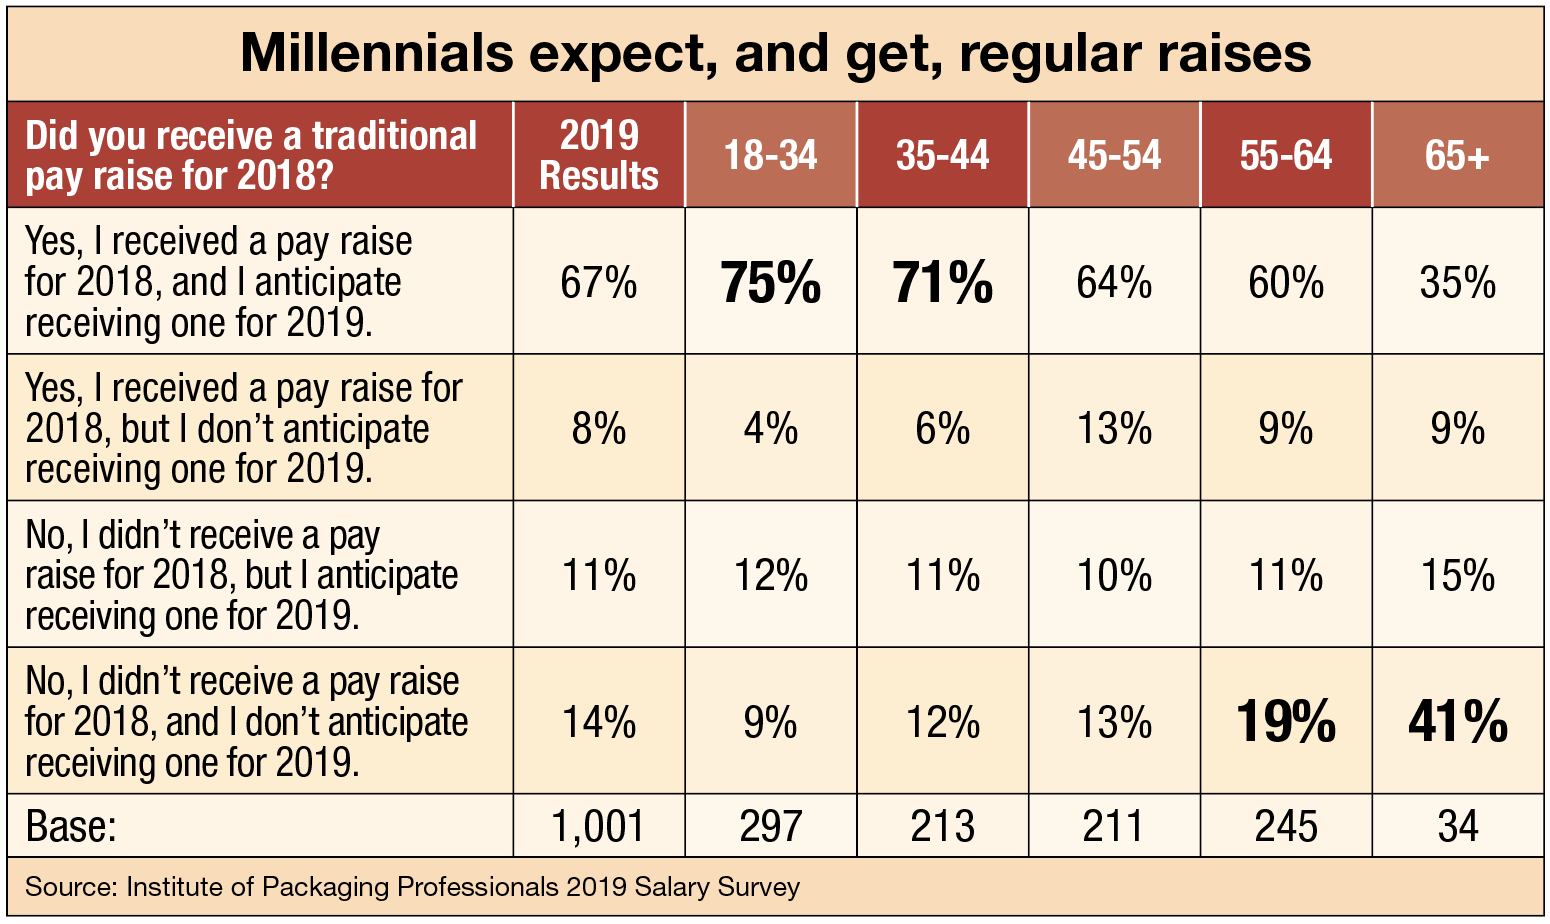
Raises are correlated to age, with those at the top of the pay scale expecting comparatively little upward mobility, as stands to reason. Younger cohorts expect, and experience, raises regularly.
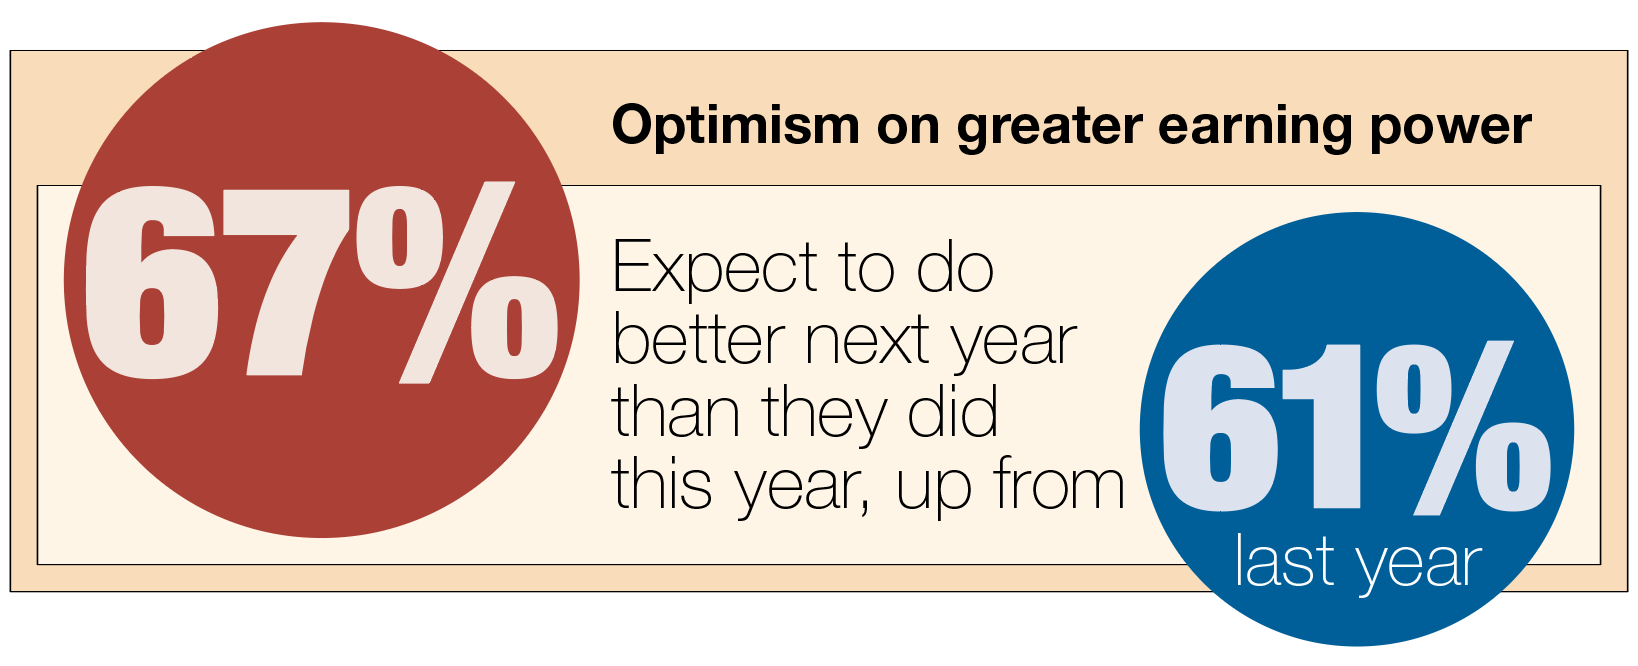
Though the demographics skew younger and less experienced than in previous years, optimism about expectation to earn more than last year
is stronger among those responding in 2019 than it was for those responding in 2018.
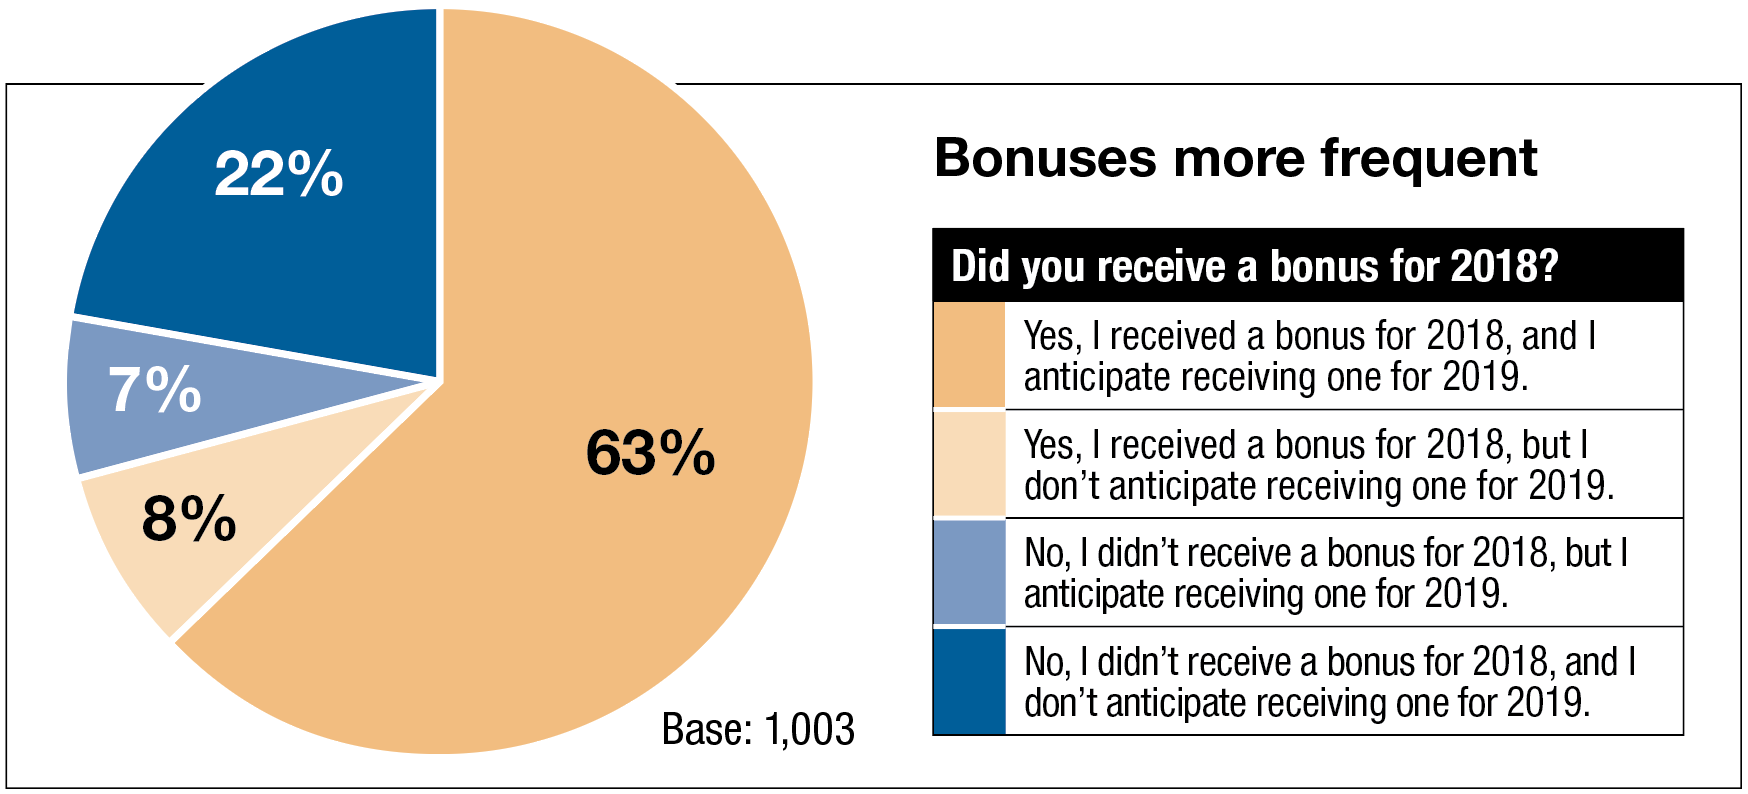
More respondents reported receiving a bonus as compared to last year’s results. More than 60% of all respondents report receiving a bonus in 2018, and they plan to get a bonus in 2018. Meanwhile, 22% of all respondents have no expectations for a bonus in either year in question.
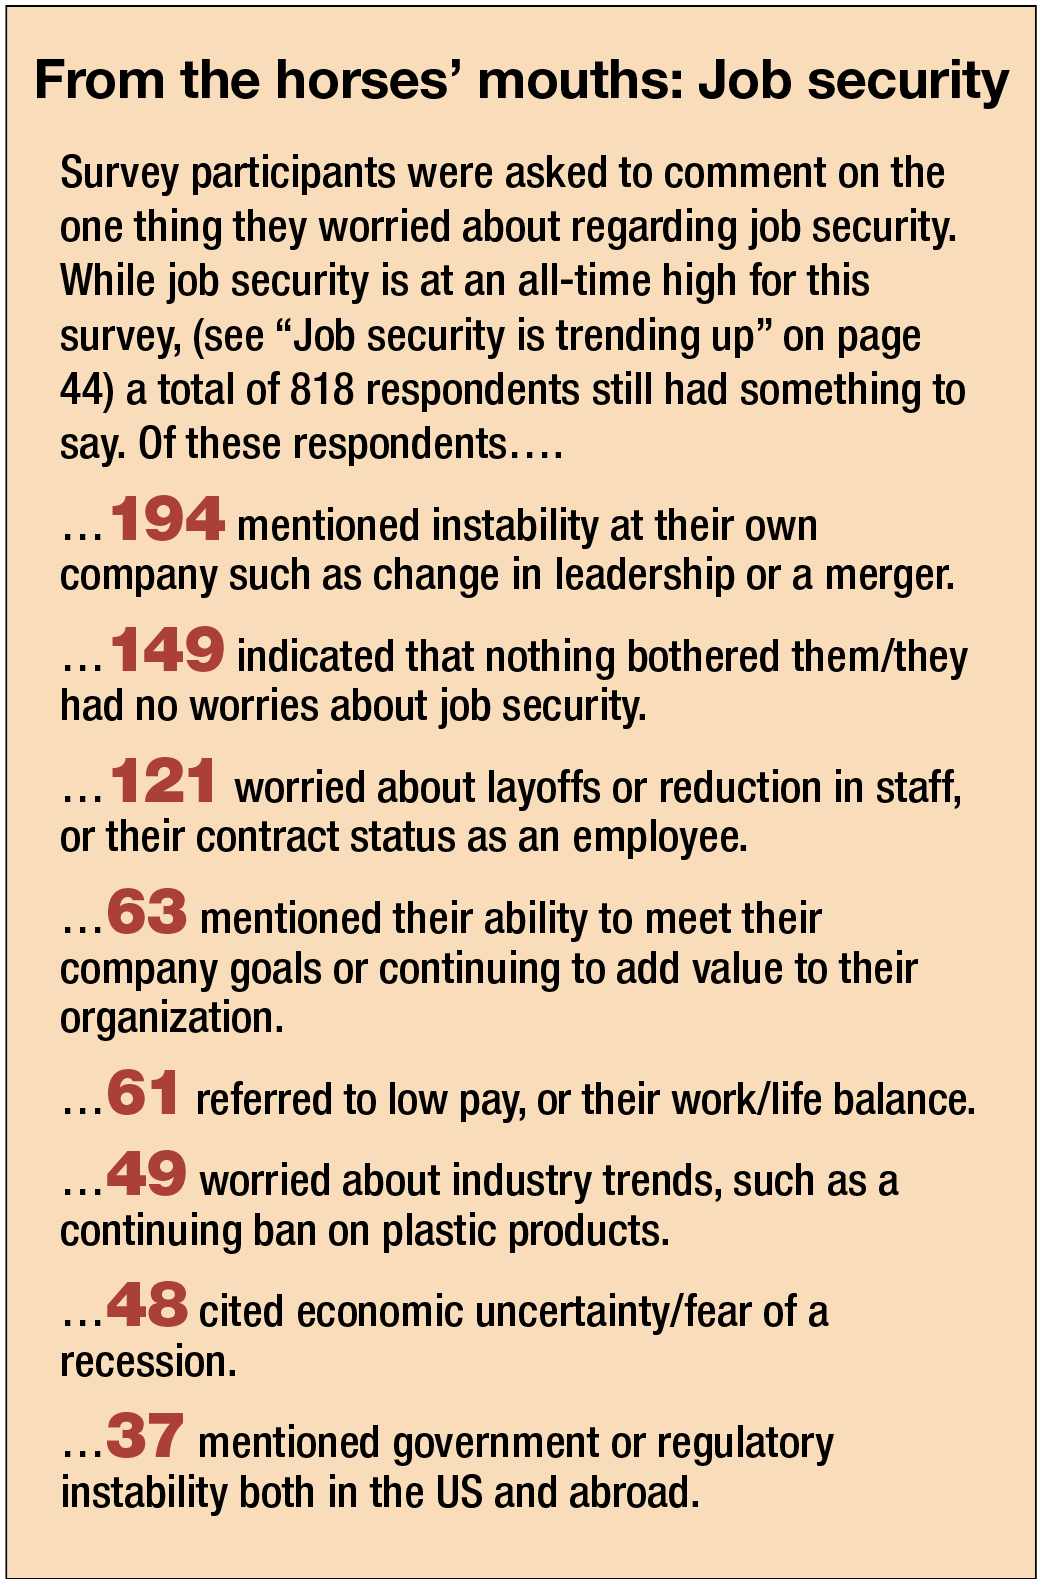
Job security is trending up
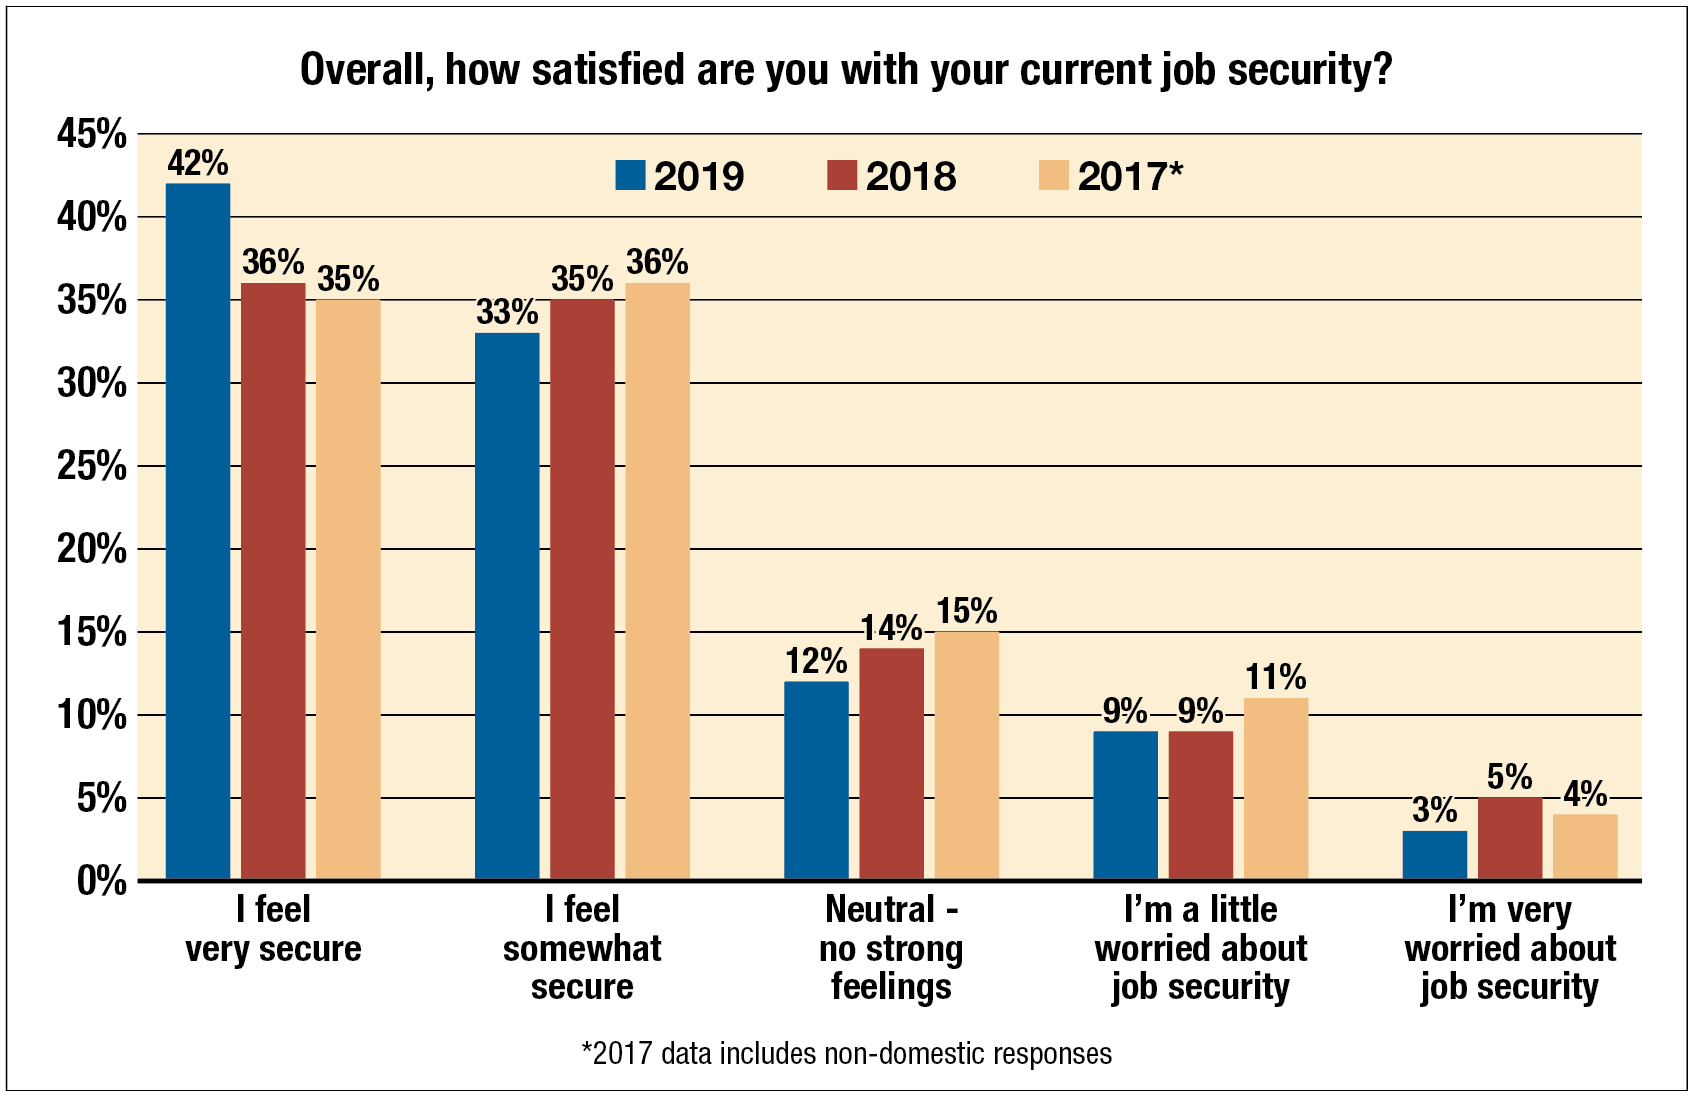
Job security is on the rise. 75% of respondents are somewhat or very secure in their jobs, up from 70% last year and the year before, and only 12% are experiencing some level of worry about their jobs, down from 15% last year and the year before. That’s good for well-staffed companies with a well-tenured, loyal employee base. But if you’re looking for talent, the market is tight.
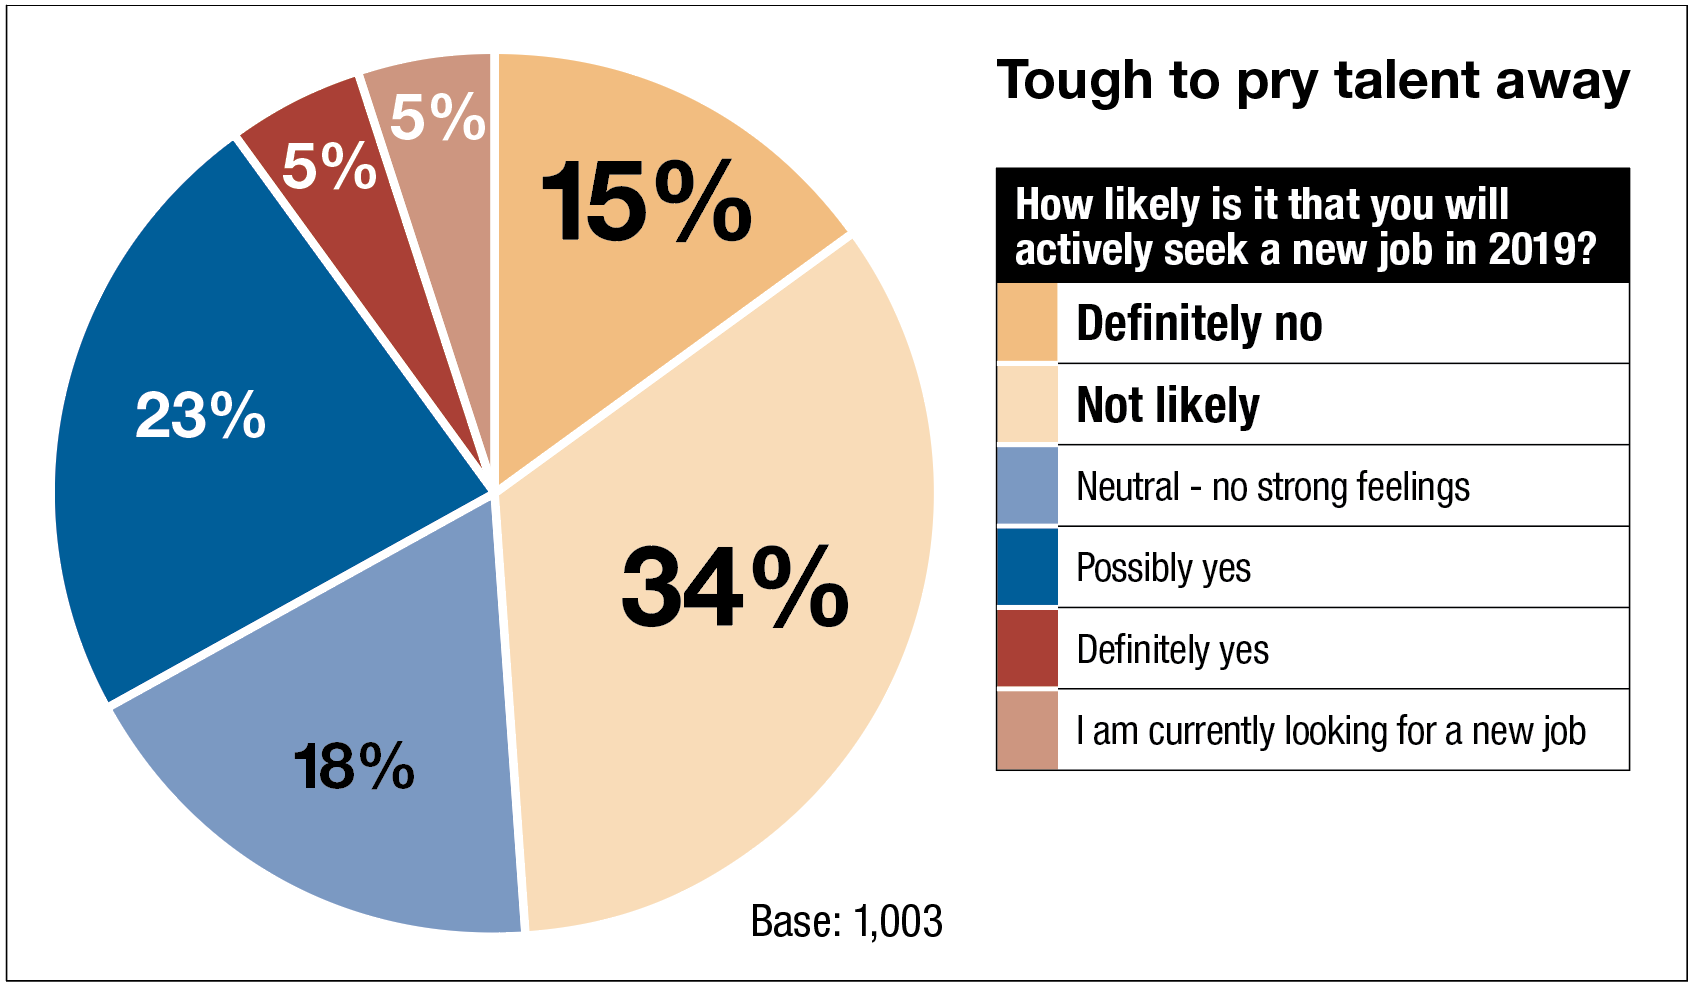
Likelihood to seek a new job has remained relatively constant since 2017, with only minor fluctuations that tend toward very slightly less likely now than in previous years. “For employers who want to expand, it’s a competitive market. Those results are proof,” adds Gros. “When the recruiter calls, most won’t answer. Nearly half, or 49% say they likely will NOT be in the job market this year, 23% say they might be, and only 10% are active job shoppers.”
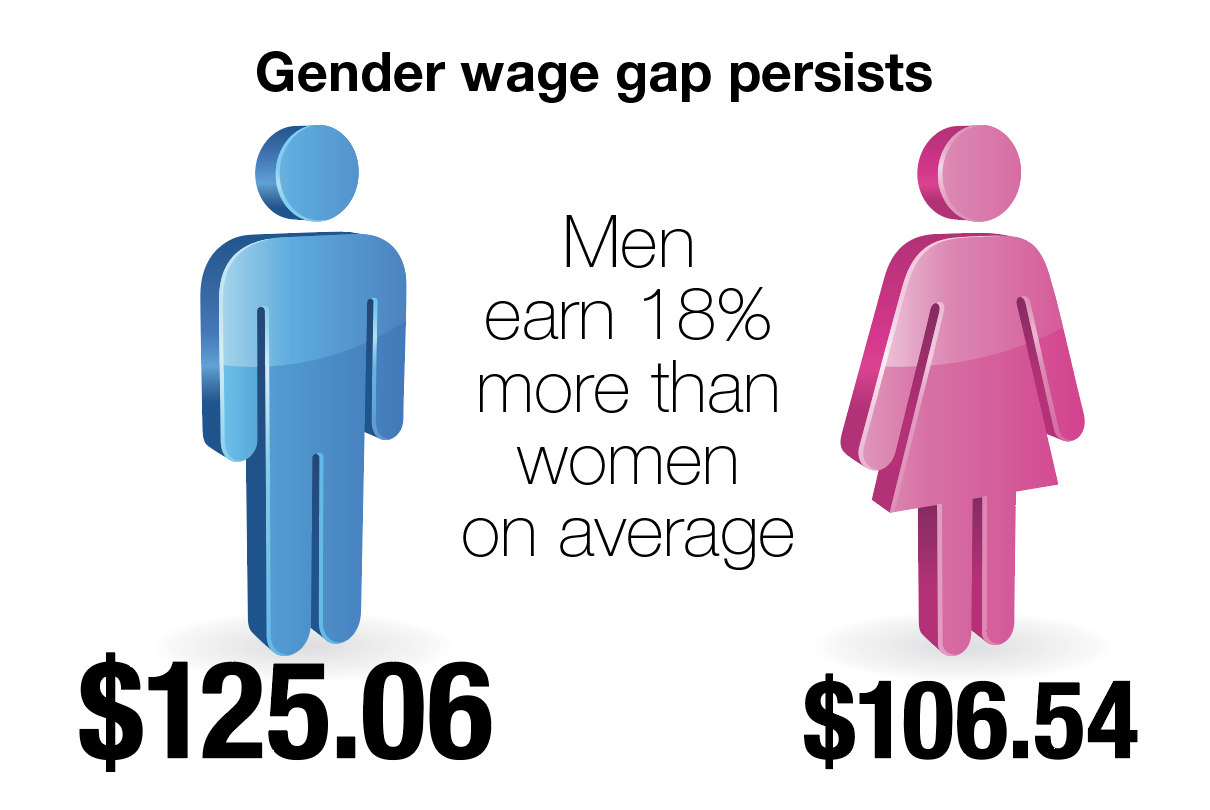
While a wage gap persists between men and women, it’s important to note that the weighted average age for male respondents was 45, while the average for women was 41. Also, men reported an average of 15 years of experience in the packaging industry to women’s average of 12. Optimistically, the relative youth and experience level of women in packaging is a good sign, representing change as more young women enter the industry after school, hopefully to stay. This also might bear some responsibility for the pay gap. Still, female representation among survey takers was flat at 25%, and it’s difficult to reconcile a four-year age and a three-year experience differential with the fact that men make nearly 20% more than women on average.
Next Packaging & Processing Women's Leadership Network
The next PMMI Packaging & Processing Women’s Leadership Network event, with the theme Exploring New Territory, will take place at PACK EXPO Las Vegas on Tuesday, Sept. 24th at 7:30 a.m. The networking breakfast will feature keynote speaker Ellen Ochoa, the first Hispanic woman ever to go to space and only the second female Director of NASA’s Johnson Space Center—where she led the human space flight enterprise for the nation from 2013 to 2018. Join over 500 women (and men!) who are leading an effort to recruit, retain and advance women’s careers in the packaging industry. Registration details will be available a tpmmi.org/ppwln.
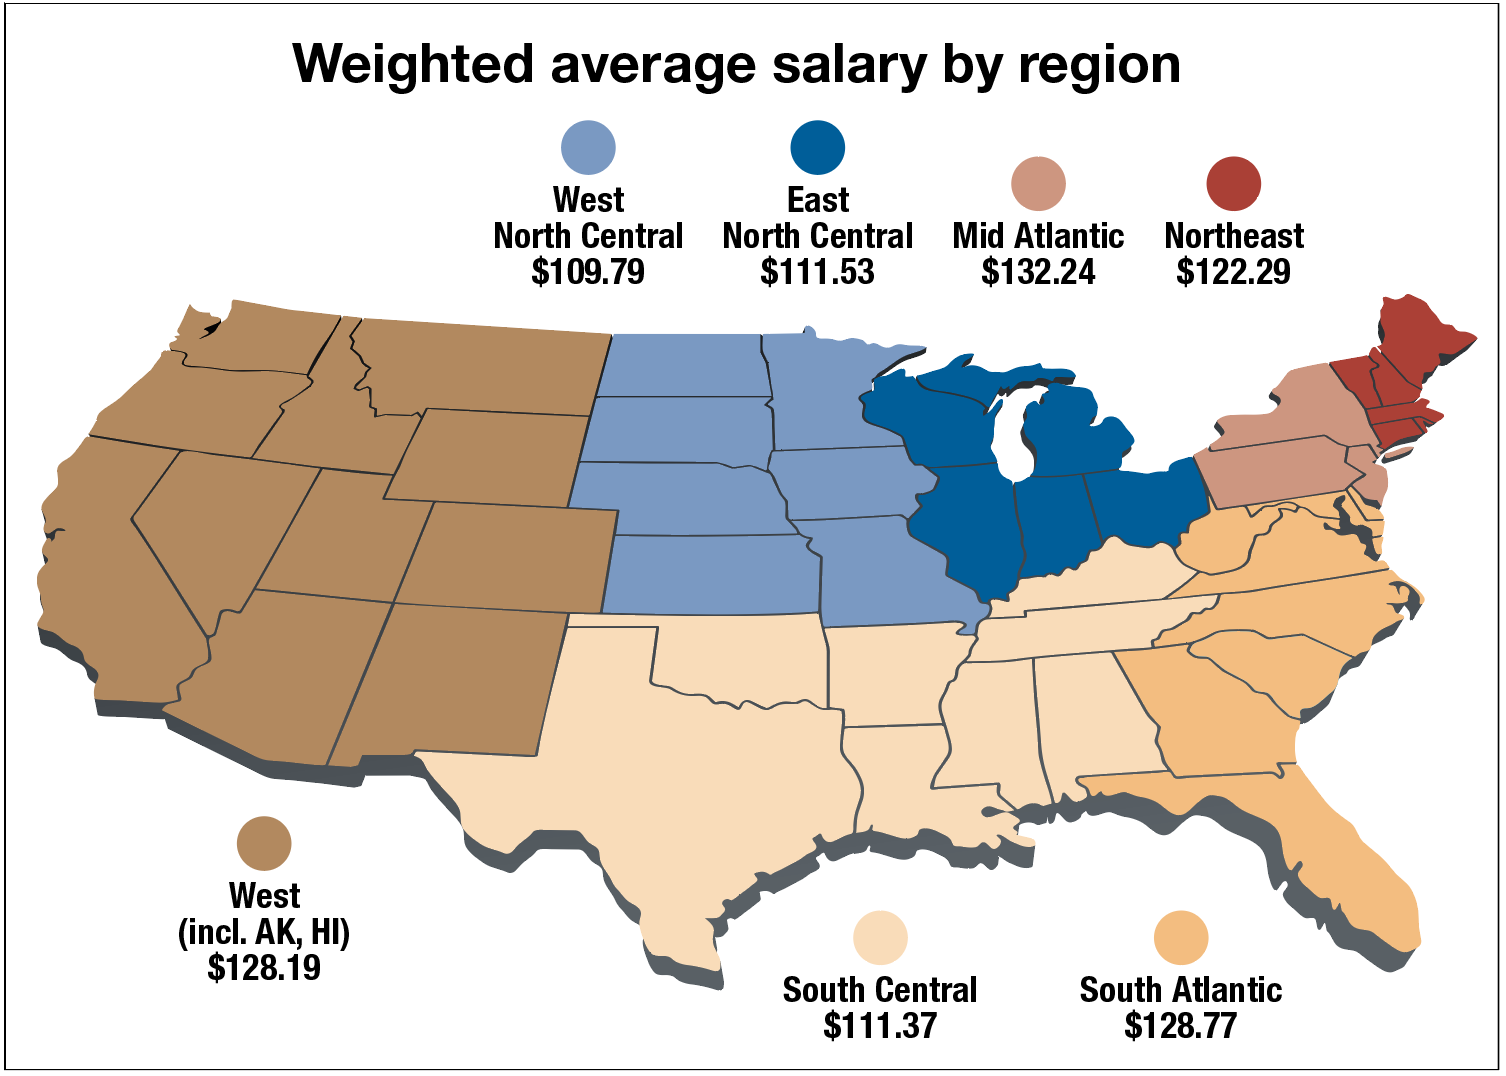
Notably, four out of five (80%) of respondents in the industrial midwestern West-North Central region receive and expect annual raises (See “Did you receive a traditional pay raise in 2018?” on page 43). But there’s a downside. “People in the Mid-Atlantic states reported the highest general compensation, $132,240, but the West North Central states reported the lowest comp, $109,790,” Gros said, despite the high likelihood of getting a raise.
A few noteworthy changes in pay by job function over the years:
• While responses indicate pay is flat at best, corporate management bucks that trend. 32% of corporate managers were at the top of the pay scale, over $200,000, in 2018, up from 28% reporting in at the top of the pay scale last year. Even so, weighted average pay remained relatively flat.
• Consultants’ earnings grew from a weighted average of $104,394 in 2016, to $128,860 in 2017, to a whopping $141,900 in 2018. This represents a 36% increase over the three-year span
• Engineers’ salary bell curve has been remarkably stable between 2016 and 2019, showing very little flux at the upper or lower ends, and remaining in the $107,000 to $109,000 weighted average range all three years. “What happens to a prolific packaging engineer? Often, they earn a promotion OUTSIDE of the department,” Gros notes. “Then a rookie replacement is hired at the lower end of the wage scale. This trend depresses the average compensation statistic for packaging engineers. However, for the individual, success has its reward.”
• R&D pros saw a significant move toward the upper ends of the pay scale, and accordingly their weighted average earnings went from $107,000-$108,000 in 2016 and 2017 respectively, to $122,840 in 2019. This represented a 15% gain in 2018 over previous years.