Discover your next big idea at PACK EXPO Las Vegas
Experience a breakthrough in packaging & processing and transform your business with solutions from 2,300 suppliers spanning all industries. Click to learn more.

Graph and analysis

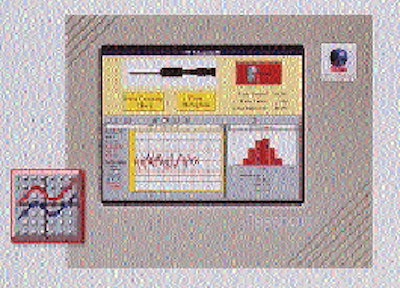
PPT Vision's (Minneapolis, MN) QuickChart is Windows-based software that offers real-time analysis and on-line graphical charting of inspection data while an inspection run is in progress.

Pw 25804 Ppt Vis Min Mn 12

It can provide histograms to check distribution of single variables, as well as X-bar/R charts for trending analysis of maximum, minimum and mean values.

Fill out the form below to request more information about Graph and analysis
Smart Filling Equipment Selection Guide
Discover the six critical factors that determine filling equipment success and avoid costly selection mistakes that drain profits.
Read More
Smart Filling Equipment Selection Guide
Annual Outlook Report: Sustainability
The road ahead for CPGs in 2025 and beyond—Packaging World editors review key findings from a survey of 88 brand owners, CPG, and FMCG readers.
Download Now
Annual Outlook Report: Sustainability