One of the key aspects of sustainability is the need to assess the ramifications of decisions about sourcing, design, and logistics. That’s because sustainable packaging is not simply about the package, but also about the context of the package.
The Sustainable Packaging Coalition and IBM are developing tools that will help in these sometimes complex assessments. Exploring how the tools work says a lot about the interrelatedness of package, process, and environment.
A COMPASS for
sustainable packaging design
As the packaging industry has recognized the strategic need for incorporating sustainability considerations, the Sustainable Packaging CoalitionSM (SPC)—an industry working group with more than 170 member companies along the supply chain—seeks to respond to the need for practical, credible guidance. This fall, the SPC will release COMPASSSM (Comparative Packaging Assessment), a tool that allows packaging designers and engineers to compare the human and environmental impacts of designs. COMPASS will be released in beta version to SPC members in the fall and will be available to all through a modest licensing fee in the winter of 2009. Visit www.design-compass.org for more information.
After surveying the often competing and confusing conversations about sustainable packaging decisions, the SPC approached the development of the COMPASS assessment tool with three guiding principles:
• Sustainability requires a life cycle perspective
• The packaging industry needs common, transparent metrics for sustainability
• Design is a critical leverage point
The project began in 2005 when, at the request of its member companies, the SPC began investigating a variety of U.S. and European packaging and product design tools that use metrics to assess environmental performance. Through that process the SPC identified a package design tool called MERGE™, developed in the mid-1990s by Environmental Defense Fund. “The SPC was granted an exclusive license by Environmental Defense Fund to redevelop the tool, which we did with the generous support of the U.S. Environmental Protection Agency,” says Martha Leflar, senior project manager of the SPC, a project of the nonprofit institute GreenBlueSM.
After three years of development, COMPASS represents an evolution of the original MERGE tool, but MERGE helped frame the objective of the project: to create a modeling tool that would allow the comparisons of packaging designs based on environmental metrics. The SPC has spent the last two years leading an intensive metric development and data collection process.
“The final metrics have undergone both an internal and external peer review involving government agencies, companies, consultancies, and environmental nongovernmental organizations (NGOs), representing what is perhaps the most valuable aspect of COMPASS—a commonly agreed upon set of metrics with which to judge environmental performance,” says Leflar. “The metrics are based on industry average life cycle inventory data, such as resource consumption and aquatic toxicity, as well as more commonly used packaging attributes, such as post-consumer recycled content.”
Beyond packaging, several of the metrics have broad applicability as useful measures at a facility or enterprise level, for example a standardized approach to measure greenhouse gas emissions or water consumption. It is the hope of the SPC that companies will begin to incorporate these metrics into their operations, in addition to whatever metrics they are currently using to measure packaging or business performance.
“If we are to continue the broader conversation about sustainability, it is essential to have these common benchmarks in order to focus efforts and minimize consumer and industry confusion about sustainability progress,” says Leflar. “COMPASS will be a success if the tool plays a small role in stimulating designers and engineers to ask better questions about the impacts of their package designs on humans and the environment with the ultimate goal of improving the sustainability profile of the packaging industry.”
IBM’s Carbon Analysis Tool
aides in decision making
IBM’s research labs recently teamed up with the IBM integrated supply chain to develop what it is calling the Carbon Analysis Tool. The tool is designed to estimate the impacts of various business decisions on generating carbon dioxide emissions. Still in development, the tool examines a company’s order transactions and then quantifies carbon dioxide emissions in order fulfillment activities. The parameters the tool takes into account include such things as service level agreements, package size, transportation modes, sourcing, and routing.
“The Carbon Analysis Tool is not just about carbon dioxide emissions,” says Bob Sanders, senior technical staff member, Corporate Packaging Programs, IBM Integrated Supply Chain. “The tool looks at carbon dioxide emissions in the context of the overall business and sees where the best decisions can be made in order to drive down both cost and emissions to a minimum.”
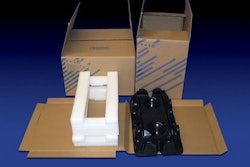
The tool has applications internally in product and package development and externally with third party logistics companies and corporate customers. For example, the tool analyzed IBM’s System x series servers shipped from Mexico to New York (see story on page 51). The tool calculated the various carbon dioxide emissions impacts based on air, train, boat, and truck modes of transportation. It even calculated the emissions difference of selecting diesel or gasoline engine trucks. The tool also calculated the benefit of adding one more day of finished goods inventory in order to eliminate partial shipments.
In one application, the tool was used to analyze a range of product groups as they moved outbound. The tool found that 16% of the carbon dioxide emissions were attributable to the weight of the packaging. The analysis showed that air shipments accounted for the largest portion of carbon dioxide emissions although the total air travel was lower than the total distance traveled by trucks. This was due to the higher carbon dioxide emissions factor for air shipments, which is nearly 11 times higher as compared to truck shipments.
The tool estimates carbon dioxide emissions based on the gross size and weight of the package and does not estimate the “carbon content” of the packaging materials as they are sourced, converted, and transported. Sanders adds, “We are beginning to meet with clients that are interested in using the Carbon Analysis Tool within their supply chains. As this space continues to evolve quickly and if clients are interested, more data can be built into the tool for even greater visibility.