Discover your next big idea at PACK EXPO Las Vegas this September
Experience a breakthrough in packaging & processing and transform your business with solutions from 2,300 suppliers spanning all industries.
REGISTER NOW & SAVE

Graph and analysis

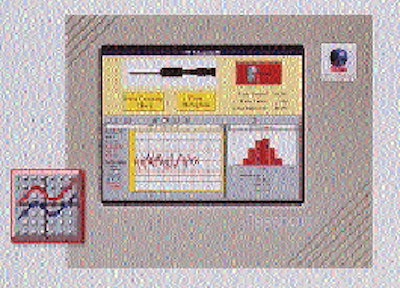
PPT Vision's (Minneapolis, MN) QuickChart is Windows-based software that offers real-time analysis and on-line graphical charting of inspection data while an inspection run is in progress.

Pw 25804 Ppt Vis Min Mn 12

It can provide histograms to check distribution of single variables, as well as X-bar/R charts for trending analysis of maximum, minimum and mean values.

Fill out the form below to request more information about Graph and analysis
Is your palletizing solution leaving money on the floor?
Discover which palletizing technology—robotic, conventional, or hybrid—will maximize your packaging line efficiency while minimizing long-term costs in this comprehensive analysis.
Read More
Is your palletizing solution leaving money on the floor?
List: Digitalization Companies From PACK EXPO
Looking for CPG-focused digital transformation solutions? Download our editor-curated list from PACK EXPO featuring top companies offering warehouse management, ERP, digital twin, and MES software with supply chain visibility and analytics capabilities—all tailored specifically for CPG operations.
Download Now
List: Digitalization Companies From PACK EXPO