UK obesity levels are on the rise—as is consumer confusion about portion size and the Guideline Daily Amount GDA system (a nutrition facts label in the UK).
In an attempt to help address this confusion, online label company Data Label surveyed more than 1,000 people aged 18 and over to determine which of the country’s big four supermarket package labels best deliver nutritional information and portion sizing details.
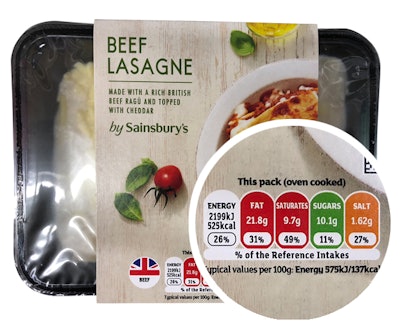
The study asked respondents to judge the labels on their own brands of 400g lasagna (considered a serving size for one person) from Asda, Sainsbury’s, Tesco, and Morrisons. The labels were displayed without the company logo and branding to ensure impartiality. The results?
Sainsbury’s supermarket finished first, with 39% of respondents finding their labels the easiest to understand. Asda closely followed at 37%. But Morrisons and Tesco lagged behind, at 15% and 10%, respectively, with consumers finding their brand labels the most confusing.
A traffic light system adopted in the UK in an effort to help consumers better realize levels of fat, saturated fats, sugar, and salt per 100g. The traffic light refers to the use of green to indicate a low amount of the substance, amber for a medium amount, and red for a high amount. Some consumers have found the system confusing in that information of food per portion varies from retailer to retailer and brand to brand.
Philip Carlyn, DataLabel’s Managing Director, says, “Each supermarket varies the weight this is worked out on, either per 100g or per portion, which could be higher or lower than 100g, depending on the product. The simple matter is that people are now consuming far more calories than they used to and a lot of this can be attributed to poor food labeling, which leads to confusing nutritional and GDA information.”