Overall equipment effectiveness (OEE) has certainly become something of a rock star in recent years. Even its critics acknowledge its power as a performance metric. Some, though, are asking a little more loudly lately, is it really as good as some of its fans claim? Can it really compare machines to other machines?
No one doubts OEE’s ability to help users to generate more capacity and profits from their machinery. Anyone who does should look at the successes at companies like the Boeing Co. The metric has helped the Seattle-based aircraft builder to find an extra 762 hours a year of capacity on nine machine tools producing parts for the 777 jetliner, the F-22 fighter jet, and other programs—all without having to reach into its pockets.
No further outlays were necessary because the data for conducting the analyses already existed on the controllers running the machines. “Getting started is as simple as gathering data through automatic status and variable monitoring, features that reside on most of today’s CNC [computer numerical control] machine tools,” explains Valerie Biester, value-added services manager, Siemens Industry Inc. in Schaumburg, Ill.
>> OEE Facts: Click here for information on the definition of OEE
Boeing collected and processed this data using Motion Control Information System (MCIS), a software module from Siemens for computing and tracking OEE and other performance metrics. Because the data are already resident in memory, the CNC can report the data to a centralized server with little impact on its own performance. “Reporting can range from a simple .xls spreadsheet of raw data for daily evaluation to more complex machine-to-machine, cell-to-cell, or even plant-to-plant comparisons for highly detailed analysis of equipment effectiveness,” says Biester.
OEE is a measure of the utilization of an asset’s productive capacity in terms of three factors—availability, performance (throughput), and quality—expressed as percentages of their ideal values. For example, performance is the actual production rate or throughput expressed as a percentage of the designed capacity of the equipment.
OEE advantages
An advantage to using OEE is that each element in the equation tells different people in the plant what they need to know about the performance of the equipment. The product of the three factors, for example, serves as an overall performance indicator for management—a kind of numerical green, yellow, or red light that alerts managers whether some sort of corrective action is necessary. The three factors themselves permit dissecting the computed value so that the people in production, quality, and maintenance can focus on improving their areas of concern.
“If OEE is in the green, then you probably won’t bother doing anything because everything underneath the surface is probably okay,” says Wendy Armel, principal MES analyst and engineer at Stone Technologies Inc., a systems integrator headquartered in Chesterfield, Mo. “If, however, it’s in the yellow or red zone, you need to dig down and figure out which piece is the problem.”
The ability to gather enough data consistently is crucial for supporting this kind of digging, as one of Stone Technologies’ recent clients discovered. The data collection tool that the company had been using was not collecting enough detail to support OEE calculations and analyses. The tool, for example, would report that the equipment ran for 7 minutes in a 10-minute window, but not why it was down for the remaining 3 minutes.
“This client was using a historian-based tool that was designed for gathering data, but not for giving them actionable details behind it,” explains Armel. “There are some tools that make OEE calculations with a simple historian. You can do it if you try hard enough, but it’s not the best solution.”
For this reason, she and her colleague Kirk Weiss, senior project manager at Stone, specified the FactoryTalk Metrics tool from Milwaukee-based Rockwell Automation, as they usually do for applications involving OEE and other performance metrics. The off-the-shelf tool not only performs the calculations, but also provides the details for revealing the root causes of inefficiencies. So, besides quantifying uptime and downtime, it could identify the source of those mysterious 3 minutes of downtime as a fault caused by an oil leak.
A controversial use
Many proponents of OEE also see the metric as a means for comparing the performance and efficiency of machines in a standardized way. They argue that expressing the three factors in its definition as percentages normalizes the machines’ specifications. “The result is not in terms of production units or minutes of downtime,” explains Gary Kohrt, vice president of marketing at Iconics Inc. headquartered in Foxboro, Mass. “Rather, it’s a simple ratio based on how well the machine performed compared to its ideal target, or theoretical maximum, within the planned production time.”
For this reason, many production facilities are using OEE to compare the performance of equipment, production lines and even the manufacturers of the equipment. Indeed, in an informal, Internet-based survey that Automation World conducted of our readers in August, a sizeable minority of the respondents, roughly a third, reported that they have used OEE for this purpose.
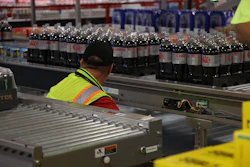
>> Video: Pepsi Boosts OEE Pepsi Bottling achieved dramatic OEE improvements across both legacy and new equipment using a combination of Lean & Sx Sigma principles. Visit bit.ly/awvid092
Other readers, however, argued against the practice. Lars Kemmann, for example, claims that OEE is not designed for this purpose. “It’s really a time-based metric for comparing a line to itself over time so you can see the impact of the changes that you’ve made based on root-cause analyses,” explains the software architect and proprietor of BynaLogic LLC, a Grafton, Wis.-based developer of technology for on-premise and cloud computing.
Although Kemmann acknowledges that OEE can sometimes be useful for comparing identical and nearly identical equipment, he argues that the metric is not always suitable for this purpose. He usually advises against such studies because OEE is the product of only three factors: performance, quality and uptime. “It doesn’t factor in things like sales and the importance to the business,” he says. “Those are things that OEE just doesn’t have any kind of theoretical basis to address.”
For this reason, comparing equipment often makes more sense with other metrics, such as the total effective equipment performance (TEEP), the product of OEE and a loading factor computed by dividing planned uptime by calendar time. “If you’re planning on running a line only one shift, rather than 24/7, then you have effectively a 30 percent loading factor on that line,” explains Kemmann. “You could improve the total volume output by 200 percent if you were to run three shifts.”
Users often neglect this loading factor when comparing lines. Kemmann points to a recent client who added a semiautomatic line to supplement a fully automated one in order to keep pace with demand from its customer. “The client never planned to run the lines for the same amount of time each day,” he says. So, he maintains that it was unfair to compare their OEEs.
Another limitation of OEE, as well as TEEP, is that the metric does not consider sales and the relative contribution that a machine or line makes to the overall business. “You have to factor in the return on investment,” says Kemmann. “If similar lines with different OEEs are serving different customers where your pricing structure is different, then comparing OEEs will not be helpful because you’re not factoring in the effects of their relative value to the business.”
Kemmann is not the only reader questioning the practice of using OEE to compare machinery and production lines. Another is Stan Grabill, principal reliability consultant at Phoenix-based Honeywell Process Solutions. “Often, the operating context in which the equipment is expected to perform varies extensively,” he explains. “So, comparing OEEs of like equipment is difficult to rationalize.”
For this reason, he and his colleagues steered clear of the practice back when he was with Honeywell’s Performance Materials and Technologies business before moving to his current position. Instead, PMT measures OEE across operating units, not just on one machine or one or two automated units. “We wanted to see where production problems occur across an entire operating unit,” says Grabill.
He recalls that a key part of establishing OEE as a useful measure was generating concise definitions at the outset when PMT’s vice president of operations introduced the metric about seven years ago. Not only did the implementation team define the factors in the OEE equation, but it also standardized the event and reason codes that operators use for daily entries, some of which require their judgment and validation by the production engineer. The definitions ensure consistency in the measurements made across all 38 plants throughout the business.
The ability to track and analyze OEE has had a profound effect on PMT’s ability to improve throughput, performance and profitability. “The whole process made us realize how underutilized our plants were,” says Grabill. “With disciplined data collection and analysis, we were able to make good business decisions on projects to drive performance.” For example, management removed from the strategic plan some projects that were too capital or technology-intensive to improve OEE.
Consequently, OEE grew from 70 percent across the division in 2006 to 78 percent in 2011. This increase was an important contributor to PMT’s overall margins rising from 10 percent to 18 percent over the same period, Grabill says.
Institutionalizing results
A common problem plaguing many users seeking similar results is an inability to sustain the initial improvements that their analysis of OEE data prompts them to make. “Typically, a continuous-improvement team looks at OEE data and implements improvements,” explains Tom Troy, director of MES solutions at Invensys Operations Management, headquartered in Plano, Texas. “When, however, the team pulls up stakes and goes off to the next project, the changes fall by the wayside. No one is charged to sustain the initial changes and drive further improvements with OEE data.”
To solve these problems, management took steps to make OEE and continuous improvement a permanent part of the culture at Rich Products Corp., a family-owned food and food services company based in Buffalo, N.Y. One of these steps was to tie OEE to the financial data by determining the dollar value of 1 percentage point of OEE (see rationale online at http://bitly/richfoods001).
A team at Rich Products developed a process for calculating the savings from incremental improvements to OEE, not only for the overall plant but also for product lines and groupings.
“With these kinds of projects, the challenge always lies in quantifying the return,” notes Troy. “To a lot of people, the returns look soft. So, it was important for Rich to come out with some really solid information on what an incremental improvement to OEE means to the organization in terms of dollars.” The link of OEE to dollars has gained both the attention and confidence of management to support initiatives based on the metric.
Another step taken at Rich Products was to put some custom software on top of the OEE data. This tool helps the company to manage incidents and their resolutions, thereby institutionalizing its responses to OEE data.
Troy notes that users also have the option of deploying workflow software that vendors have already developed for “digitizing” procedures. Tools such as Invensys’ ArchestrA Workflow provide a framework for sustaining process improvements from OEE projects. When a key performance indicator exceeds a predefined limit, the software can execute a predetermined action plan established by the continuous-improvement team, automatically involving the right people.
Consider a scenario in which downtime exceeded 30 minutes in a shift on Line 1. The software may bring together people from maintenance, operations and engineering normally responsible for the line to investigate and correct the cause. After looking at the data, they may decide that some maintenance is in order and turn the problem over to the maintenance organization. The incident is not closed until the corrective action occurs.
“So, there is visibility into who has done these actions and what’s still open and who is responsible for them,” says Troy at Invensys. “Things are not left open ended.”
Not only does the practice embed OEE into the company’s culture, but it also prevents any further controversies from erupting over the usefulness of the performance metric.