The total flexible packaging industry is estimated to be about $27.2 billion in annual sales for 2013. This includes packaging for retail and institutional food and non-food (including medical and pharmaceutical), industrial materials, shrink and stretch films, retail shopping bags, and consumer storage bags, as well as wraps and trash bags.
That’s according to the Flexible Packaging Assn.’s “2014 State of the Flexible Packaging Industry Report,” (pwgo.to/1071), which provides industry converters, suppliers, investors, and analysts with insight into the performance (growth, revenue/volume expectations, profitability, capital spending) of the U.S. flexible packaging industry over the past year.
The report focuses on the segment of the industry that adds significant value to flexible materials, usually by performing multiple processes. This segment is estimated to be about $21.2 billion for 2013, and does not include retail shopping bags, consumer storage bags, or trash bags.
The report notes, “The process of manufacturing flexible packaging materials utilizes any or all of the following: laminating or co-extrusion to combine materials, coating of films and paper, and/or printing. Generally taking the shape of a bag, pouch, liner, or overwrap, etc., flexible packaging is defined as any package or any part of a package whose shape can be readily changed.”
Data available in the report is gathered through several industry sources including FPA members, the “State of the Flexible Packaging Industry Survey,” the FPA non-members “Industry-Wide Converter Survey,” the U.S. Census Bureau’s latest “Annual Survey of Manufacturers,” and the FPA long-term historical model of flexible packaging industry growth.
The industry has shown steady growth over the last 20 years with two exceptions: the downturn of 2001 and the “Great Recession” of 2009. This steady growth and expansion has been aided by innovation in technology and products, growth in new and existing markets, and an ability to adapt to the ever-changing environment of today’s marketplace.
For 2012-2013, FPA estimates an annual growth rate of 2.8%.
Over the period, 2003-2013, flexible packaging has grown at a compound annual rate of 2.6% per year. The U.S. flexible packaging industry employs nearly 79,000 people and encompasses a wide variety of manufacturing methods, materials, and resources. The average flexible packaging converter is a small-to-medium-size company with annual sales totaling about $65 million to $68 million.
The top 100 flexible packaging companies (out of the estimated total of 408) account for nearly 76% of total industry revenue with an average size of about $207 million. The top 10 flexible packaging companies account for nearly half (47%) of flexible packaging industry revenue and have average sales of about $1.2 billion to $1.3 billion. The majority of flexible packaging plants are concentrated in the Midwest, although many plants exist in the Southeast and in California.
FPA insights
Among the highlights of the report are the following:
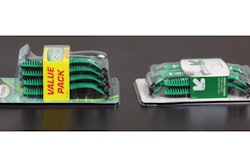
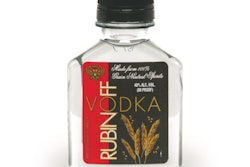
• Of the $27.2 billion U.S. flexible packaging spend last year, retail food represented the largest chunk of the pie at $16 billion. Retail non-food was next at $4.3 billion, followed by medical and pharmaceutical at $2.3 billion.
• Among the top end-use markets for converters pharmaceuticals ranked fifth while medical devices ranked ninth.
• In the medical and pharmaceutical end-use market—business-to-business and business-to-consumer segment—key factors were packaging for hospital and clinic supplies and pharmaceuticals, and $2.3 billion, or 9% of the total flexible packaging market. Specific areas mentioned were biological, dental supplies, diagnostics, disposable products, medical devices, medical supplies, pharmaceuticals—OTC and prescription—and veterinarian supplies and medications.
• Global commerce in flexible packaging is expected to resume its growth for the foreseeable future. Among the key countries that influence the U.S. flexible packaging trade deficit are China, Taiwan, and South Korea. Commerce with them accounted for a negative trade balance or trade deficit of $1,796.6 million in 2012, compared with $1,097.1 million the previous year, an increase of about 64% and accounts for 83% of the total 2013 flexible packaging trade deficit. China alone showed a trade deficit of $1,606.6 million in 2013, up 75% from 2012 levels, and accounts for over 89% of the region’s trade deficit.
FPA’s “2014 State of the U.S. Flexible Packaging Industry Report” is available in the Members Only section of www.flexpack.org. A printed copy of the report is available to non-FPA members for $3,500. For more information, visit the FPA website or contact Bob Zaborowski, Director, Business and Economic Research, [email protected], 410/694-0800.
FPA is the U.S. association of flexible packaging manufacturers, and flexible packaging material and equipment suppliers.