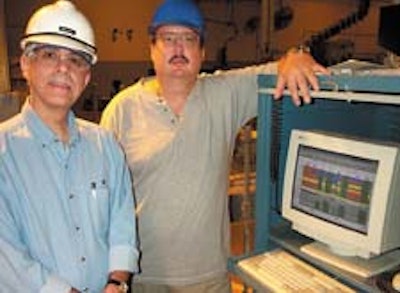
PPG’s data acquisition upgrade was set in motion back in ‘92 when Bruno Pierannunzio’s quest began with a question.
When he joined PPG eight years ago in the newly created position as packaging engineer, Pierannunzio was issued this challenge by his manager: “Make the packaging lines World Class.’’
“I didn’t know what that meant,” he relates, and he wanted to find out. For years, he’d looked for ways to measure packaging line performance and, in fact, had a number of systems in place at PPG Dover. Yet they’d failed for one reason or another. Either no one paid close enough attention or the data was considered bogus, he relates. Meanwhile, through industry organizations, he connected with Zarpac president Paul Zepf, who told him of a manual benchmarking system Zarpac had developed. Not simply a software vendor, Zarpac is a packaging engineering consulting firm.
“We wanted a system without operator intervention,” says Pierannunzio. “However, when Zarpac said they’d been looking to automate the system with a partnering customer, I wanted us to be that company.” That was ‘97.
“The question over the years is what is efficiency and how do you measure it,” asks Pierannunzio. “Zarpac’s PI objectively defines how packaging line performance should be measured. I haven’t seen a better number than this.”
Performance Index, or PI, measures four major production aspects:
• System utilization
• Speed factor
• Efficiency or wastage
• Schedule capability.
Each is measured and given a decimal number from 0.000 to 1.000. Factored together, they yield what Zarpac calls the Performance Index, or PI. A perfect “score” would be 1.0, or 1x1x1x1.
“If you’re doing those four factors well, you’ve got a boring-to-watch, but very smooth running line producing quality product on schedule,” says Pierannunzio.
Two of four
PPG currently measures only two of PI’s four factors, speed and system utilization. The others are difficult to determine or require manual input and thus are currently each assigned a value of 1.0. Pierannunzio says this is due in part to the fact they currently don’t have the ability to track automatically all wastage with line sensors, which would include having to know how many labels and cases they’ve wasted. Due to the variation of its production scheduling, the “scheduling” factor is very difficult to predict, Pierannnunzio says. “By starting our emphasis on improving system utilization and speed factor, we feel that we’ll gain higher production rates, repeatability and consistency. As a by-product, we feel that waste and schedule capability will improve as well.”
Zarpac has developed a list of what it considers “world class” performance with respect to PI in various industries. Pierannunzio relates that in the paint industry, this is a PI of 0.6, which equates to four factors noted above of 0.8.
“If you were doing that well and had a 0.6 PI, you would probably be blowing the competition away,” Pierannunzio states.
See the main story that goes with this sidebar: PPG paints precise picture of production
