Call it the great recession, call it the deepest recession since the Great Depression, but call 2009 an economic and financial nightmare, right? Not necessarily, according to many packaging professionals responding to the 2009 Salary Survey conducted by the Institute of Packaging Professionals and Packaging World magazine, developed in cooperation with Gros Executive Recruiters.
A total of 2,634 usable replies were received from IoPP members and nonmembers between Jan. 12 and Feb. 12, 2010. That represents a significant increase compared to the 1,637 respondents to the previous year’s IoPP/Packaging World survey. Market research for both surveys was completed by Kane Consulting.
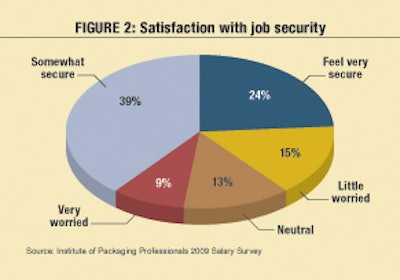
Fifty-nine percent of respondents reported that their companies experienced some economic-related measures due to the economic downturn of 2009. Layoffs were noted by 42% of those respondents, with the reduction of benefits noted by 20%, reduction in work hours by 19%, and pay cuts by 15% (see Figure 3). Despite those hardships, 63% of respondents noted they were either somewhat secure (39%) or very secure (24%) with their job (see Figure 2). Most worried were those working in structural design (36%) and as consultants (35%).
Promotions in 2009 were down slightly from the previous year’s 16%. Of the 13% of respondents receiving promotions last year, those with three to five years of experience were most likely to receive them.
A vast majority (85%) of respondents indicated they experienced no job change last year. Six percent said they voluntarily joined a new employer, while 4% said they joined a new firm after termination. Another 4% were unemployed following involuntary termination.
When asked if they would actively seek a job, 33% said a search was unlikely, 20% said they possibly would, 17% said they would not, 15% had no strong feelings either way, 9% said they were currently looking, and 6% said yes, they were definitely looking for a new job.
Bottom-line salary details
With all of 2009’s economic troubles, the average total earnings, including salary, bonus, cash incentives, and commission, was $101,470, down only slightly from the previous year’s $101,879 average (see Figure 1).
IoPP reports that 43% of survey respondents saw an increase in earnings in 2009, which “is down significantly” from last year’s 65%. Bonuses were down as well, from 59% in 2008 to 54% in 2009. The average 2009 bonus was 10.3%, slightly better than the 10.2% reported the previous year. And 14% of those earning a bonus indicated the amount was 20% or more of their income.
More than one-third (36%) of respondents work in the North Central regions, with 19% in the Northeast. Respondents in the Mid-Atlantic, made up of NJ, NY, and PA, reported the highest average total earnings (including salary, bonus, cash incentives, and commission) of $116,620. At the low end of earnings geographically were respondents in the West North Central (IA, KS, MN, MO, ND, NE, SD) with an average of $96,980. IoPP noted that respondents in the East North Central (IL, IN, MI, OH, WI) region “were most likely to experience a decrease in compensation during 2009, while respondents in the West North Central were less likely to experience this occurrence.”
Eighty percent of survey respondents were male, earning an average of $105,180, about $20,000 more than the $85,570 earned by female respondents. Male respondents were nearly five years older (45.5 years) than female (40.9 years) respondents. Age had a direct impact on compensation. Regardless of gender, salary averages ranged from $51,670 for respondents between 18 and 24 to $139,080 for those 65 and older. The average respondent age was 44.59.
Not surprisingly, greater packaging experience and education also translated into greater income. The average respondent had 14.4 years of packaging experience, with males averaging 15 years, and females 11.6 years. Those with at least 20 years of experience in the business averaged $122,800, nearly double the $62,310 for those in their first or second year. Respondents with a high school education reported an average income of $79,460, while those with post-graduate studies or a PhD made $109,770 on average. The most frequently mentioned education level reached among survey respondents was an undergraduate degree, at 43%.
Asked about IoPP membership, 39% of survey respondents noted they were association members. That paid off as member income averaged $104,770, compared with $99,570 for nonmembers. A substantial change from last year’s survey, IoPP noted, was that only 14% of this year’s respondents are Certified Packaging Professionals, compared to 21% last year. CPPs averaged $98,510 of income, lower than the $102,100 reported by nonCPPs.
Company/respondent demographics
End users of packaging machinery, materials, and/or services represented 46% of survey respondents, with 37% suppliers, 9% both end users/suppliers, and 8% others. Supplier representative income was $108,543 compared to $97,797 for end-user professionals (see Figure 4). That said, end-user firm representatives were more likely to receive a pay raise.
Packaging materials suppliers represented the largest respondent group at 28%, followed by food at 21%, packaging machinery at 14%, beverage 12%, pharmaceutical 11%, cosmetics/personal care 11%, contract packaging 11%, services 9%, electronics 8%, and consulting services 5%. Those totals surpass 100% as respondents could select among supplier and end-user categories, as well as different industries. Among this year’s noteworthy survey findings were the following:
• Twenty-nine percent of all respondents were engineers, with marketing/sales next at 19%, followed by R&D (15%), and corporate management (12%). Income by job function (see Figure 5) revealed that corporate management income averages ranked the highest, at $149,891. Next came marketing/sales ($112,989), consultants ($110,921), R&D ($96,563), engineering ($89,776), purchasing ($86,537), production ($84,024), and structural design ($73,082).
• The average survey respondent worked in a company with 13,138 employees. Respondents at companies with at least 50,000 employees made the most income, averaging $109,310. However, income levels did not necessarily correlate with company size. For example, professionals at the smallest companies, with one to nine workers, earned $101,070 annually, while the lowest income average was $94,830, reported by respondents at companies employing 500 to 999 employees. Conversely, supervisory authority did have a direct impact on average earnings, with staff members making $86,340 annually and company officers pulling down $158,080.
Career satisfaction
Half of the survey’s respondents indicated they were either somewhat satisfied (33%) or very satisfied (17%) with their wages, while 30% were either somewhat dissatisfied (22%) or very dissatisfied (8%) with their earnings. IoPP reported that end-user company respondents tended to be more satisfied than those who work at supplier organizations.
Respondents expressed more satisfaction with benefits than wages, as 66% indicated they were either somewhat satisfied (37%) or very satisfied (29%) with employer benefits, although that was slightly down from the 71% who fell into those two categories in last year’s survey. Workers in companies with 10 or fewer employees were the least satisfied with their benefits. The survey listed 13 benefits on its questionnaire, with the average respondent receiving 8.26 of them. Paid holidays, paid vacation, medical insurance, dental insurance, and a 401(k)/403(b) were the five most-frequently noted benefits offered by employers.
When surveyed about job duties, 45% of respondents said they were somewhat overburdened (35%) or extremely overburdened (10%). Respondents working for end users were more likely to say they were overburdened than those at supplier firms.
Looking ahead to this year, more than half of survey respondents (53%) expected to earn more in 2010 than last year, while 10% thought they’d earn less. For the most part, increased earning expectations for 2010 were highest at younger age groups, where 69% of those aged 18 to 24 anticipated greater earnings while only 36% of those 65 and older had such expectations.
For IoPP members, the complete 2009 Salary Survey is available for free at www.iopp.org/journal.
For nonmembers, the survey is available at www.iopp.org/store.