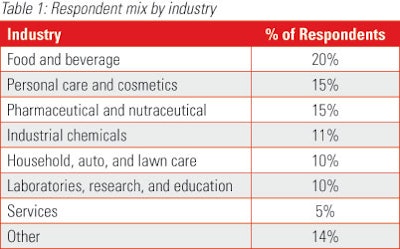
Table 1
According to the U.S. Bureau of Economic Analysis, U.S. consumers spent more than $10 trillion in 2012. This spending was made across billions of individual transactions and influenced by a wide array of dynamics. How well any company or product does in the market is based on how successfully it understands and embraces (and even helps form) these dynamics. Research into what consumers need and want is useful to improve the odds of winning more transactions and garnering a greater share of wallet.
In 2011, Berlin Packaging published a white paper titled “Consumer Megatrends and Packaging Implications: How Companies Can Ride Consumers’ Coattails.” It identified consumer motivations and how values, behaviors, and attitudes translated into overarching consumer trends. That paper was a qualitative review of literature and prior research, and it presented a set of trends and broad packaging implications.
The study presented here, on the other hand, takes the research
one step further and works to quantitatively assess, through a broad-based survey of packaging professionals, the lifestage of each trend (whether it is on the rise or in decline), the adoption rate of each trend (whether companies are reacting to the trend), and the packaging tactics
being used.
Methodology and approach
Berlin Packaging surveyed thousands of packaging professionals in December, 2012. The survey was conducted using a web-based research tool called SurveyMonkey. Berlin received 1,097 survey responses. Respondents cut across many different industries (Table 1) and many different roles (Table 2).
The survey centered on ten consumer megatrends (Table 3). Respondents commented on each megatrend in three ways (Figure 1):
• Momentum: Placing the megatrend in its lifecycle stage.
•
Adoption: Selecting to what degree the respondent’s company is reacting to the megatrend.
•
Packaging Tactics: Within the megatrends that were being adopted, identifying the packaging tactics being used.
Results
Results were analyzed in three steps. The first step independently assessed consumer momentum and company adoption for overall respondent feelings on the existence of trends and activity. The second step looked at the relationship between momentum and adoption responses and built an Intensity Matrix for each trend. The third step distilled these matrices and located the “center of gravity” for each trend; this simplifies how the data are shown and helps with synthesizing implications.
Step 1
The vast majority of respondents see each of these trends as having momentum to one degree or another. Table 4 shows the lifestage in which respondents place each trend. For example, just 3% of respondents see the Rise of Boomers Megatrend as Nonexistent, while 64% see it as thriving.
Few respondents (less than 23% in the peak case) see these trends as Nonexistent. Indeed, more than 50% of respondents classify six of the ten trends as Thriving, and nine trends meet the 50% mark when combining both the Thriving and Emerging buckets. But while the trends are acknowledged by the vast majority of respondents, many companies still are not reacting; this is what we call poor adoption. Table 5 shows how respondents rate the involvement of companies in each trend.
On average across the trends, 46% of respondents report that their company has No Involvement in the trends. And looking at the companies that are involved, fewer than 30% of companies report to have commercialized solutions to eight of the ten trends. This is an important finding, and leaders should discuss—even at this high level—whether they are properly addressing these trends. Additional insight can be gained by looking at a cross-tabulation of the data, as we’ll see shortly.
Step 2
An Intensity Matrix (Table 6) arrays respondents across two dimensions. The vertical axis shows the degree of momentum that respondents cited for a trend, with high momentum (Thriving) at the top of the table. The horizontal axis shows the degree of adoption companies have with a trend, with high adoption (the company has commercialized items that address that trend) to the right. This better explains the data we looked at in Step 1, since we’re now more closely linking a company’s actions with the momentum perceived by that same company. For each trend, every respondent can be placed into this matrix, and then each cell can be looked at as a percentage of all respondents. The greater the percentage in any cell, the greater is the respondent intensity for that cell. For example, the Intensity Matrix for the Rise of Boomers megatrend is shown in Table 7.
In the matrix shown in Table 7, 100% of respondents are represented. In terms of momentum, the far right column shows the vast majority of respondents see this as a trend with healthy momentum; 64% see the trend as Thriving and another 13% see it as Emerging. Yet the bottom row shows only 26% of all respondents have a commercialized product that addresses this trend and only 29% have products in some form of testing. This adds more detail than we saw in Step 1 of the analysis. Further, respondents are cross-tabulated into momentum/adoption cells. The cell with the largest population of respondents is the Thriving/No Involvement cell (with 24% of all respondents). This underscores the fact that many companies are not responding and reacting to trends they admit are real and important.
Step 3
The detailed data of each megatrend’s Intensity Matrix were then distilled into a single point that we call the “center of gravity.” This is where we see the predominant number of respondents in terms of momentum and adoption. This point is plotted onto a chart that shows the same momentum/adoption spectra.
Chart 1 shows the center of gravity for the Rise of Boomers megatrend. It boils the Intensity Matrix down to the predominance of responses being Thriving or Emerging momentum and being Low to Moderate levels of adoption. This approach necessarily has a lower-resolution of data, but it helps to highlight in a simple way how each trend is perceived by the survey respondents.
Looking at the center of gravity for all the megatrends (Chart 2) highlights the variation in how companies are appreciating and addressing the megatrends.
Implications
There are two top-level implications from this analysis. The first area addresses the strategic gaps—where consumers’ momentum is strong but companies are not offering solutions. This helps to focus energy in the biggest areas of opportunity. The second implication area looks to the specific packaging tactics being employed. At a minimum, this helps to establish what’s being done today and may spur improvements in those tactics or a look to other approaches.
Given that no megatrend was classified on average as having a Waning or Nonexistent momentum, we zoomed in on the top half of the centers of gravity chart to identify strategic gaps and opportunities. Chart 3 synthesizes the centers of gravity chart and positions each megatrend into one of five sectors, marked as A through E. Each sector has a different imperative.
• Sector A: Attack
These are highly-developed trends with low company involvement (on average). Trends in this sector represent opportunities to invest and jump ahead to meet consumer needs. Start by speaking to consumers to understand their needs and requirements.
• Sector B: Learn
These are highly-developed trends with good company involvement (on average). For companies that are lagging, there are chances to observe and learn from others. For companies that are participating, there are still ways to improve by looking outside your industry or in other geographies to find ways to stand out. Consumer research should be a pillar of work here as well.
• Sector C: Join
These are emerging trends with low- to mid-adoption (on average). Now is the time to investigate these trends with consumer, competitor, and category research. A word of caution, however; this is where “fads” will show up—trends that fizzle out and never achieve sustainable consumer momentum.
• Sector D: Watch
These trends need to be studied more closely. Some will be emerging and on the upswing, while others may be waning. In this study, no centers of gravity fell into this bucket, although your company may be positioned here depending on how you are embracing certain trends.
• Sector E: Advance
This sector is for highly-adopted trends. The implication here is to anticipate the future evolution of consumer needs. In addition, you can experiment and look for new ways to enhance the tactics being used to build even greater acceptance among consumers. No trend in this study achieved near-universal levels of adoption, but certain companies may operate in this space.
Consider each of the megatrends and place your own company on this chart. Even at this high level, you may find things you should rethink about your innovation, marketing, and go-to-market strategies.
The survey also identified the tactics currently being employed for each megatrend. As an example, for Rise of Boomers, four packaging tactics were explored: enlarged print, improved ergonomics, easy open, and compliance packaging. Table 8 shows the packaging tactics being employed by respondents that are testing or have commercialized products.
The level of engagement is varied across these four tactics. For example, Easy Open is being implemented by nearly three-fourths of respondents, while only 30% are engaged with Enlarged Print. This doesn’t mean that companies should jump to using larger print; instead, companies need to evaluate how well these tactics apply to their specific situations and consumers. But, if a tactic has merit, engaging in the tactic before the competition does can be a useful advantage.
Table 9 shows the tactics used by survey respondents for all consumer megatrends.
This list of packaging tactics is broad but offers many areas for further investigation. Packaging can help build a product’s relevance to consumers. This list can guide discussions on how to harness packaging’s power to appeal to and resonate with consumers.
Summary
While this study found general agreement in the existence of the ten megatrends, a large proportion of companies are not engaging in or adopting the trends. This suggests there are important opportunities for companies to supercharge how well they respond to consumers and, thus, improve how well they perform financially.
Your company’s position may not conform to the survey averages. A useful step is to place each of the ten megatrends into its momentum lifestage for your markets and segments. Then you can assess how well your company is addressing or adopting each trend. Packaging can be a valuable tool in making products that resonate with these trends, so you should have thorough discussions and engage the right partners that can bring expertise to the table. This overall process will help focus your resources and will increase the odds that you can attract, retain, and engage consumers. And because consumer needs are always evolving, keeping the pulse of consumers is an evergreen project that should be built into your regular marketing and planning cycle.
Jeremy Lagomarsino is vp of business development & strategy for Berlin Packaging; he can be reached at [email protected].