The use of key performance indicators (KPIs) is growing, and none faster than Overall Equipment Effectiveness (OEE). Why is this methodology being employed in more and more plants? For one thing, it is easier to implement than many performance improvement strategies.
You simply measure three things: availability, performance (throughput) and quality against their optimal or ideal levels. Thus, if a machine is capable of producing 100 parts a minute but it is actually producing 70, then that machine’s performance OEE number is 70 percent. Perform the same analysis for availability (time in operation) and quality (acceptable parts produced), multiply the three percentages, you arrive at an overall OEE number.
OEE, says Todd Smith, FactoryTalk metrics product manager for Rockwell Automation, “is a simple performance indicator to which all managers can relate. Because it shows a machine’s actual performance compared to its theoretical maximum, OEE can be applied to accurately compare any machine or any line, in any industry, anywhere in the world.”
The fact that it can be implemented relatively easily is only one of the drivers behind the growth of OEE. There is also the fact that OEE helps a plant wring more production out of existing equipment without the need to invest in new machines or personnel. This was a major factor during the recent recession and remains so today, particularly in the packaging industry.
“Margin pressure since 2010 has been increasing,” says Barry Lynch, global industry manager for consumer products at GE Intelligent Platforms. “The cost of energy, raw materials and packaging materials among other factors have all been increasing. As a result, companies are looking for ways to drive up the profitability of existing assets. OEE is a key metric in helping them do this.”
Because it’s a relatively simple and robust process, the data required for OEE can be collected with a clipboard and a pen if need be. In fact, that’s typically the way it has been done, notes Mike Pantaleano, business manager for information software and manufacturing intelligence, Rockwell Automation. “Unfortunately, paper and Microsoft Excel spreadsheets, collected manually with questionable, not-so-timely data, continues to be the leading way of collecting OEE. Luckily, the trend is for customers to expect to know how they are doing now instead of how they did last week.”
To accomplish this, says Pantaleano, they are turning to software to gather data directly from equipment in a non-subjective manner to gain actionable information. But he cautions that successful implementation of a software system for “performance management” (Rockwell’s preferred name for this class of software) is dependent on making sure that 1) your software is easy-to-use, 2) that you have canned reports and information “dashboards” to speed and simplify installation and operation and minimize subjective factors, and 3) that you are able to collect event, state and machine level details to provide to key decisions makers. “After all this, then you can convince [users] to put down the clipboard.”
Isolated data
Putting down the clipboard in favor of automated data gathering and OEE monitoring may still leave some machine data relatively isolated, warns Jeff Nuss, product manager, Wonderware MES, Invensys Operations Management. This is particularly so in cases where “the customer gets data from an ‘OEM’ed’ application included with their equipment where they might not be able to change the calculation, or the data might be self-contained and not available across different pieces of equipment.” This undermines the key benefit of OEE, says Nuss, which is the ability to relate performance metrics across equipment, work centers and plants.
It’s not just machines that can pose problems. The software used to collect and correlate OEE and other KPI data can itself cause headaches even while offering solutions. Rockwell’s Pantaleano puts it this way: “Some software solutions can require many changes at the control or automation layer. Other packages may require that an entire monolithic infrastructure be in place, while some solutions may require an entire rip-and-replace [strategy], so you have to review the software landscape carefully.”
There’s another obstacle to automated OEE measurement, warns Jim Hulman, business development manager, process, packaging, painting, converting for Bosch Rexroth (www.boschrexroth.com). Typically, he points out, not all of the equipment on the plant floor is automated: “Existing machinery may require a manual process.” He stresses that implementers of OEE “must remain flexible” and adds that the collection and analysis of OEE and other KPI data is evolving in response to technological and internal cultural changes.
Andy Hansbrough, market development manager for motion system provider Kollmorgen, sees this evolution heading toward greater integration of OEE functionality within the machine—the OEE onboard approach. “Operation teams need OEE or equivalent metrics from their machines and factories to be productive and accomplish their objectives. The easier it is for them to understand factory performance, the easier it is for them to take action when and where it is needed. So expect more integration of OEE with machines as a value added feature,” he adds.
That is, provided that the machine’s OEE functionality can communicate easily with the OEE functionality in machines supplied by other OEMs, as Rockwell’s Pantaleano points out. “The concept of ‘information-enabled equipment’ is still not a main priority for many OEMs, but is clearly becoming an issue for their end users, who try to stitch solutions together from a variety of OEMs.”
Pantaleano sees OEE and potentially a broader group of machine-based KPIs” as having a continuing and growing impact on the packaging industry, including packaging equipment OEMs.
Packagers, he insists, need to have better information on how their machines are actually performing, and they are increasingly expecting this functionality to be built into equipment before it arrives.”
Manufacturers, he says, already appreciate the value of a new piece of equipment that is easy to integrate into their existing infrastructure. In the past, though, that integration was viewed largely as being dependent on what programmable logic controller / programmable automation controller (PLC/PAC) the OEM used, and the power constraints of the equipment. “Now we are seeing more end users expect information integration, asking, ‘What data can I easily access from this machine? Can I easily make it part of my existing IT infrastructure? Does this equipment have built-in KPIs?’ OEMs need to be prepared to answer.”
Shining a light
With all this talk about the continuing and growing impact of OEE, it’s important to back up a moment and stress that OEE numbers by themselves do not provide specifics about what might be wrong with a machine or line, or how to fix it. Instead, OEE numbers shine a light, revealing fruitful areas to look for improvement. Barry Lynch’s experience highlights that fact.
While helping a client install an OEE system at a plant in the United Kingdom, Lynch observed a machine that was known to be a bottleneck, but no one was sure why. “As the operator ran the machine, a red light kept flashing on the panel, and the operator kept resetting it as he walked past. I enquired as to the purpose of the light and was told it was a machine alarm indicating the machine was starved of product coming in. The fault only occurred for 10 or 15 seconds at a time but occurred frequently.
Lynch’s team installed the OEE system and the next day developed some basic reports in Excel that pulled the downtime data out and categorized it by time and fault. “Those ‘micro stops’ actually added up to about one hour of lost production a day due to the fact that this machine was running faster than the machine feeding it. A simple multiplication of cost per unit and number of units produced in an hour came up with a daily loss of 10,000 Pounds Sterling,” he says.
This figure prompted the company to investigate putting in a second feed to increase the flow of product to the micro-stopping machine, which came to a cost of 50,000 pounds. They chose this route, and the upgrade paid for itself in five days. It also enabled them to increase capacity by 10,000 units per day.
“The customer saw an increased output capacity of 8 percent just from addressing this one machine,’’ notes Lynch.
Rockwell’s Todd Smith relates a similar experience. “When a performance management software system incorporating OEE at a large beverage manufacturer pointed to a large amount of downtime in a tunnel heater machine, operators simply didn’t believe the data because they weren’t seeing the machine stop.” He says that closer investigation revealed that the machine was actually stopping several times per second because the machine’s heaters were undersized. “The heaters were shutting due to overheating, stopping and then starting up again after cooling down—all within a split second.”
In this instance, says Smith, “a single OEE point was not enough to spark change on the plant floor. Instead, leveraging additional objective, fact-based data points from the control system—and using them to identify root causes and specific improvements that would reduce costs—were eye opening.”
That “additional objective, fact-based data” that Smith speaks of was provided and analyzed by the Rockwell software package that contained OEE functionality. Rockwell calls this Performance Management software. Jeff Nuss’s Invensys calls its broader, OEE-encompassing package Wonderware MES Performance. GE Intelligent Platforms terms their comparable offering Proficy Operations Management software. Broadly speaking, these software packages augment OEE’s ability to throw a light on problems with tools to readily analyze those problems and devise corrective action.
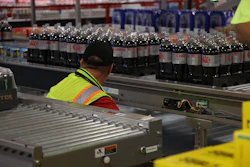
This was the case at Cliffstar Corp., a Dunkirk, N.Y., producer of juices, sports drinks, teas and private-label beverages. In order to produce those products more efficiently, Cliffstar implemented GE’s operations management software at one of its plants to track and monitor production, leveraging real-time and historical data analysis to uncover root causes of inefficiencies.
The GE software links the plant floor data to Cliffstar’s enterprise resource planning (ERP) system in order to drive increased visibility across the operations. Their challenges included packaging material direct losses of 1 percent, raw material direct losses of 1 percent, and process variance-driven raw losses of 4 percent, in addition to the financial losses caused by idled labor and machines.
After the implementation, Cliffstar reported 3.1 percent higher average plant line efficiency in the first five months, a 157 percent internal rate of return (IRR) for this pilot project. The company also reported reduced waste and improved production flexibility.
“What we’ve seen in the industry,” says Pantaleano, “is an explosion of KPIs (OEE being a leader) that manufacturers want to see at a high level, but they also want the ability to drill down into the information to get very detailed reasons for why they are seeing certain values for specific KPIs.”
Dos and don’ts
Regardless of whether you implement OEE by itself or as part of a larger software solution, there are certain fundamental things to keep in mind. First, involve all relevant parties—from plant floor to plant management—early on in the process. Otherwise, machine performance management will begin to seem like an imposition, or a flavor-of-the-month tactic that won’t be fully utilized.
Second, as Valerie Biester, value added services manager for the machine tool business unit of Siemens Industry Inc. observes, “Keep it simple. Too much data is just that. If there is too much, it is confusing. If it is confusing, you will not use the system that has been implemented to help you.”
Third, do not use the OEE data as the basis for either reward or punishment—either one will encourage people to fudge the data.
Fourth, act on the data to make process improvements. By itself the data can’t improve your operations—that’s up to you.
Finally, measure the result of your actions and, where appropriate, take further action. “After implementing changes,” says Rockwell’s Todd Smith, “it’s important to measure the outcomes of the improvements in order to determine the greatest areas of impact and pinpoint places where further improvements may be required.”