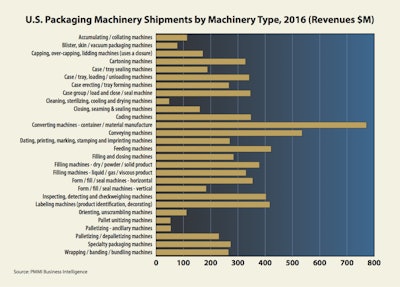
Packaging machinery sales in the U.S. grew 4.8% in 2016, totaling $9.8 billion, according to a new study from PMMI Business Intelligence. Domestic OEMs accounted for $7.7 billion and grew 2.9% from 2015. Imports of packaging machinery from foreign manufacturers grew 12.7%, accounting for just a little over $2 billion in sales.
Most of these machines come from Germany, Italy, and Canada (top 3) with China in 4th place. A favorable exchange rate and aggressive marketing were cited as reasons for the healthy increase.
Sales of machinery into food plants accounted for 36.5% ($2.8 billion) of the U.S. market, and are predicted to grow with a compound annual growth rate (CAGR) of 2.3% through 2022.
Beverage plants purchased $1.7 billion worth of packaging machinery, accounting for the next biggest piece of the pie—22% of all U.S. packaging machinery sales.
Pharmaceutical plants purchased $6.19 billion of packaging machinery, accounting for 8% of U.S. machinery sales. This market sector promises the most robust CAGR through 2022 with a forecast of 3.2%.
The entire study, State of the Industry—Packaging Machinery 2017, is available at www.pmmi.org/business-intelligence. The report contains extremely detailed breakout by machinery types, etc.